(MENAFN- PR Newswire)
NEW YORK, Aug. 16, 2022 /PRNewswire/ -- A rotary steerable system is a directional drilling tool that is designed for continuous rotation from the surface while drilling. Thus, it eliminates the need to slide the steerable motor. Rotary steerable systems are employed for directional drilling, horizontal drilling, and extended-reach drilling of wells. These systems offer the ability to drill directionally. In addition, these systems do not require stopping or slowing down to change direction, which enables continuous drilling activities.
Attractive Opportunities in Rotary Steerable Systems Market by Application and Geography - Forecast and Analysis 2022-2026
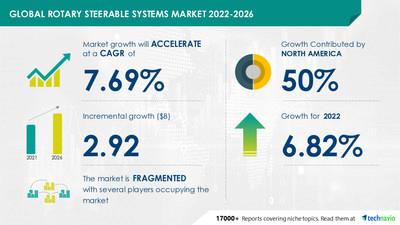
The rotary steerable systems market size is expected to grow by USD 2.92 billion from 2021 to 2026. In addition, the growth momentum of the market will accelerate at a CAGR of 7.69% during the forecast period.
Make confident decisions using the benchmarks and analysis provided by Technavio. Download Free PDF Sample Report
Market Driver The increase in investments toward directional drilling is driving the growth of the market. Directional drilling helps in controlling the direction of the wellbore being drilled. It is mainly used for offshore and unconventional oil and gas production. Moreover, it helps reach the shale reservoir with a horizontal path to cover maximum contact with the reservoir. According to the IEA, the global investment in upstream oil and gas grew by around 5% in 2018 compared to 2017. The increase in upstream investments varies based on the upstream oil and gas companies. These factors will drive market growth during the forecast period.
Key Vendors The rotary steerable systems market is fragmented, and the vendors are deploying organic and inorganic growth strategies to compete in the market. APS Technology Inc., Baker Hughes Co., Compass Directional Guidance Inc., D Tech Rotary Steerable, DoubleBarrel RSS, Enteq Upstream Plc, Gyrodata Inc., Halliburton Co., Huisman Equipment BV, HXR Drilling Services, INCO DRILLING BV, LEAM Drilling Services, NOV Inc., Schlumberger Ltd., Scientific Drilling International, Turbo Drill Industries Inc., and Weatherford International Plc, among others, are the main players in the market.
This report provides a full list of key vendors, their strategies, and the latest developments. Buy Now to gain access to exclusive information about major vendors
Rotary Steerable Systems Market Application Outlook (Revenue, USD bn, 2021-2026) - Onshore - size and forecast 2021-2026
- Offshore - size and forecast 2021-2026
Rotary Steerable Systems Market Geography Outlook (Revenue, USD bn, 2021-2026) - North America - size and forecast 2021-2026
- Europe - size and forecast 2021-2026
- APAC - size and forecast 2021-2026
- Middle East and Africa - size and forecast 2021-2026
- South America - size and forecast 2021-2026
Learn about the contribution of each segment summarized in concise infographics and thorough descriptions. View a FREE PDF Sample Report
Revenue-generating Application Segment The onshore segment will be the largest revenue-generating application segment during the forecast period. Drilling automation is mainly used in onshore oil and gas projects. Onshore drilling includes the setting up of oil rigs as well as the drilling of oil wells on land surfaces. These projects have a low initial cost and time compared with offshore drilling. Such factors will fuel the growth of this segment during the forecast period.
Regional Analysis North America will account for 50% of the market's growth during the forecast period. The growth of this region is attributed to factors such as the recovery in crude oil prices and the significant growth in shale oil production in the US. Moreover, market growth in this region will be faster than the growth of the market in other regions. The US and Canada are the key countries for the rotary steerable systems market in North America.
Related Reports Borehole Enlargement Systems Market by Application and Geography - Forecast and Analysis 2022-2026
Rigless Intervention Services Market by Application and Geography - Forecast and Analysis 2022-2026
| Rotary Steerable Systems Market Scope |
| Report Coverage | Details |
| Page number | 120 |
| Base year | 2021 |
| Forecast period | 2022-2026 |
| Growth momentum & CAGR | Accelerate at a CAGR of 7.69% |
| Market growth 2022-2026 | USD 2.92 billion |
| Market structure | Fragmented |
| YoY growth (%) | 6.82 |
| Regional analysis | North America, Europe, APAC, Middle East and Africa, and South America |
| Performing market contribution | North America at 50% |
| Key consumer countries | US, Canada, Oman, China, Russia, and Argentina |
| Competitive landscape | Leading companies, Competitive strategies, Consumer engagement scope |
| Key companies profiled | APS Technology Inc., Baker Hughes Co., Compass Directional Guidance Inc., D Tech Rotary Steerable, DoubleBarrel RSS, Enteq Upstream Plc, Gyrodata Inc., Halliburton Co., Huisman Equipment BV, HXR Drilling Services, INCO DRILLING BV, LEAM Drilling Services, NOV Inc., Schlumberger Ltd., Scientific Drilling International, Turbo Drill Industries Inc., and Weatherford International Plc |
| Market dynamics | Parent market analysis, market growth inducers and obstacles, fast-growing and slow-growing segment analysis, COVID-19 impact and recovery analysis and future consumer dynamics, and market condition analysis for forecast period. |
| Customization purview | If our report has not included the data that you are looking for, you can reach out to our analysts and get segments customized. |
Browse Energy Market Reports
Table of Contents 1 Executive Summary
- 1.1 Market overview
- Exhibit 01: Executive Summary – Chart on Market Overview
- Exhibit 02: Executive Summary – Data Table on Market Overview
- Exhibit 03: Executive Summary – Chart on Global Market Characteristics
- Exhibit 04: Executive Summary – Chart on Market by Geography
- Exhibit 05: Executive Summary – Chart on Market Segmentation by Application
- Exhibit 06: Executive Summary – Chart on Incremental Growth
- Exhibit 07: Executive Summary – Data Table on Incremental Growth
- Exhibit 08: Executive Summary – Chart on Vendor Market Positioning
2 Market Landscape
- 2.1 Market ecosystem
- Exhibit 09: Parent market
- Exhibit 10: Market Characteristics
3 Market Sizing
- 3.1 Market definition
- Exhibit 11: Offerings of vendors included in the market definition
- 3.2 Market segment analysis
- Exhibit 12: Market segments
- 3.4 Market outlook: Forecast for 2021-2026
- Exhibit 13: Chart on Global - Market size and forecast 2021-2026 ($ million)
- Exhibit 14: Data Table on Global - Market size and forecast 2021-2026 ($ million)
- Exhibit 15: Chart on Global Market: Year-over-year growth 2021-2026 (%)
- Exhibit 16: Data Table on Global Market: Year-over-year growth 2021-2026 (%)
4 Five Forces Analysis
- 4.1 Five forces summary
- Exhibit 17: Five forces analysis - Comparison between 2021 and 2026
- 4.2 Bargaining power of buyers
- Exhibit 18: Chart on Bargaining power of buyers – Impact of key factors 2021 and 2026
- 4.3 Bargaining power of suppliers
- Exhibit 19: Bargaining power of suppliers – Impact of key factors in 2021 and 2026
- 4.4 Threat of new entrants
- Exhibit 20: Threat of new entrants – Impact of key factors in 2021 and 2026
- 4.5 Threat of substitutes
- Exhibit 21: Threat of substitutes – Impact of key factors in 2021 and 2026
- 4.6 Threat of rivalry
- Exhibit 22: Threat of rivalry – Impact of key factors in 2021 and 2026
- 4.7 Market condition
- Exhibit 23: Chart on Market condition - Five forces 2021 and 2026
5 Market Segmentation by Application
- 5.1 Market segments
- Exhibit 24: Chart on Application - Market share 2021-2026 (%)
- Exhibit 25: Data Table on Application - Market share 2021-2026 (%)
- 5.2 Comparison by Application
- Exhibit 26: Chart on Comparison by Application
- Exhibit 27: Data Table on Comparison by Application
- 5.3 Onshore - Market size and forecast 2021-2026
- Exhibit 28: Chart on Onshore - Market size and forecast 2021-2026 ($ million)
- Exhibit 29: Data Table on Onshore - Market size and forecast 2021-2026 ($ million)
- Exhibit 30: Chart on Onshore - Year-over-year growth 2021-2026 (%)
- Exhibit 31: Data Table on Onshore - Year-over-year growth 2021-2026 (%)
- 5.4 Offshore - Market size and forecast 2021-2026
- Exhibit 32: Chart on Offshore - Market size and forecast 2021-2026 ($ million)
- Exhibit 33: Data Table on Offshore - Market size and forecast 2021-2026 ($ million)
- Exhibit 34: Chart on Offshore - Year-over-year growth 2021-2026 (%)
- Exhibit 35: Data Table on Offshore - Year-over-year growth 2021-2026 (%)
- 5.5 Market opportunity by Application
- Exhibit 36: Market opportunity by Application ($ million)
6 Customer Landscape
- 6.1 Customer landscape overview
- Exhibit 37: Analysis of price sensitivity, lifecycle, customer purchase basket, adoption rates, and purchase criteria
7 Geographic Landscape
- 7.1 Geographic segmentation
- Exhibit 38: Chart on Market share by geography 2021-2026 (%)
- Exhibit 39: Data Table on Market share by geography 2021-2026 (%)
- 7.2 Geographic comparison
- Exhibit 40: Chart on Geographic comparison
- Exhibit 41: Data Table on Geographic comparison
- 7.3 North America - Market size and forecast 2021-2026
- Exhibit 42: Chart on North America - Market size and forecast 2021-2026 ($ million)
- Exhibit 43: Data Table on North America - Market size and forecast 2021-2026 ($ million)
- Exhibit 44: Chart on North America - Year-over-year growth 2021-2026 (%)
- Exhibit 45: Data Table on North America - Year-over-year growth 2021-2026 (%)
- 7.4 Europe - Market size and forecast 2021-2026
- Exhibit 46: Chart on Europe - Market size and forecast 2021-2026 ($ million)
- Exhibit 47: Data Table on Europe - Market size and forecast 2021-2026 ($ million)
- Exhibit 48: Chart on Europe - Year-over-year growth 2021-2026 (%)
- Exhibit 49: Data Table on Europe - Year-over-year growth 2021-2026 (%)
- 7.5 APAC - Market size and forecast 2021-2026
- Exhibit 50: Chart on APAC - Market size and forecast 2021-2026 ($ million)
- Exhibit 51: Data Table on APAC - Market size and forecast 2021-2026 ($ million)
- Exhibit 52: Chart on APAC - Year-over-year growth 2021-2026 (%)
- Exhibit 53: Data Table on APAC - Year-over-year growth 2021-2026 (%)
- 7.6 Middle East and Africa - Market size and forecast 2021-2026
- Exhibit 54: Chart on Middle East and Africa - Market size and forecast 2021-2026 ($ million)
- Exhibit 55: Data Table on Middle East and Africa - Market size and forecast 2021-2026 ($ million)
- Exhibit 56: Chart on Middle East and Africa - Year-over-year growth 2021-2026 (%)
- Exhibit 57: Data Table on Middle East and Africa - Year-over-year growth 2021-2026 (%)
- 7.7 South America - Market size and forecast 2021-2026
- Exhibit 58: Chart on South America - Market size and forecast 2021-2026 ($ million)
- Exhibit 59: Data Table on South America - Market size and forecast 2021-2026 ($ million)
- Exhibit 60: Chart on South America - Year-over-year growth 2021-2026 (%)
- Exhibit 61: Data Table on South America - Year-over-year growth 2021-2026 (%)
- 7.8 US - Market size and forecast 2021-2026
- Exhibit 62: Chart on US - Market size and forecast 2021-2026 ($ million)
- Exhibit 63: Data Table on US - Market size and forecast 2021-2026 ($ million)
- Exhibit 64: Chart on US - Year-over-year growth 2021-2026 (%)
- Exhibit 65: Data Table on US - Year-over-year growth 2021-2026 (%)
- 7.9 China - Market size and forecast 2021-2026
- Exhibit 66: Chart on China - Market size and forecast 2021-2026 ($ million)
- Exhibit 67: Data Table on China - Market size and forecast 2021-2026 ($ million)
- Exhibit 68: Chart on China - Year-over-year growth 2021-2026 (%)
- Exhibit 69: Data Table on China - Year-over-year growth 2021-2026 (%)
- 7.10 Russia - Market size and forecast 2021-2026
- Exhibit 70: Chart on Russia - Market size and forecast 2021-2026 ($ million)
- Exhibit 71: Data Table on Russia - Market size and forecast 2021-2026 ($ million)
- Exhibit 72: Chart on Russia - Year-over-year growth 2021-2026 (%)
- Exhibit 73: Data Table on Russia - Year-over-year growth 2021-2026 (%)
- 7.11 Canada - Market size and forecast 2021-2026
- Exhibit 74: Chart on Canada - Market size and forecast 2021-2026 ($ million)
- Exhibit 75: Data Table on Canada - Market size and forecast 2021-2026 ($ million)
- Exhibit 76: Chart on Canada - Year-over-year growth 2021-2026 (%)
- Exhibit 77: Data Table on Canada - Year-over-year growth 2021-2026 (%)
- 7.12 Argentina - Market size and forecast 2021-2026
- Exhibit 78: Chart on Argentina - Market size and forecast 2021-2026 ($ million)
- Exhibit 79: Data Table on Argentina - Market size and forecast 2021-2026 ($ million)
- Exhibit 80: Chart on Argentina - Year-over-year growth 2021-2026 (%)
- Exhibit 81: Data Table on Argentina - Year-over-year growth 2021-2026 (%)
- 7.13 Oman - Market size and forecast 2021-2026
- Exhibit 82: Chart on Oman - Market size and forecast 2021-2026 ($ million)
- Exhibit 83: Data Table on Oman - Market size and forecast 2021-2026 ($ million)
- Exhibit 84: Chart on Oman - Year-over-year growth 2021-2026 (%)
- Exhibit 85: Data Table on Oman - Year-over-year growth 2021-2026 (%)
- 7.14 Market opportunity by geography
- Exhibit 86: Market opportunity by geography ($ million)
8 Drivers, Challenges, and Trends
- 8.3 Impact of drivers and challenges
- Exhibit 87: Impact of drivers and challenges in 2021 and 2026
9 Vendor Landscape
- 9.2 Vendor landscape
- Exhibit 88: Overview on Criticality of inputs and Factors of differentiation
- 9.3 Landscape disruption
- Exhibit 89: Overview on factors of disruption
- 9.4 Industry risks
- Exhibit 90: Impact of key risks on business
10 Vendor Analysis
- 10.1 Vendors covered
- Exhibit 91: Vendors covered
- 10.2 Market positioning of vendors
- Exhibit 92: Matrix on vendor position and classification
- 10.3 APS Technology Inc.
- Exhibit 93: APS Technology Inc. - Overview
- Exhibit 94: APS Technology Inc. - Product / Service
- Exhibit 95: APS Technology Inc. - Key offerings
- 10.4 Baker Hughes Co.
- Exhibit 96: Baker Hughes Co. - Overview
- Exhibit 97: Baker Hughes Co. - Business segments
- Exhibit 98: Baker Hughes Co. - Key news
- Exhibit 99: Baker Hughes Co. - Key offerings
- Exhibit 100: Baker Hughes Co. - Segment focus
- 10.5 D Tech Rotary Steerable
- Exhibit 101: D Tech Rotary Steerable - Overview
- Exhibit 102: D Tech Rotary Steerable - Product / Service
- Exhibit 103: D Tech Rotary Steerable - Key offerings
- 10.6 DoubleBarrel RSS
- Exhibit 104: DoubleBarrel RSS - Overview
- Exhibit 105: DoubleBarrel RSS - Business segments
- Exhibit 106: DoubleBarrel RSS - Key offerings
- Exhibit 107: DoubleBarrel RSS - Segment focus
- 10.7 Halliburton Co.
- Exhibit 108: Halliburton Co. - Overview
- Exhibit 109: Halliburton Co. - Business segments
- Exhibit 110: Halliburton Co. - Key news
- Exhibit 111: Halliburton Co. - Key offerings
- Exhibit 112: Halliburton Co. - Segment focus
- 10.8 Huisman Equipment BV
- Exhibit 113: Huisman Equipment BV - Overview
- Exhibit 114: Huisman Equipment BV - Product / Service
- Exhibit 115: Huisman Equipment BV - Key offerings
- 10.9 NOV Inc.
- Exhibit 116: NOV Inc. - Overview
- Exhibit 117: NOV Inc. - Business segments
- Exhibit 118: NOV Inc. - Key news
- Exhibit 119: NOV Inc. - Key offerings
- Exhibit 120: NOV Inc. - Segment focus
- 10.10 Schlumberger Ltd.
- Exhibit 121: Schlumberger Ltd. - Overview
- Exhibit 122: Schlumberger Ltd. - Business segments
- Exhibit 123: Schlumberger Ltd. - Key offerings
- Exhibit 124: Schlumberger Ltd. - Segment focus
- 10.11 Scientific Drilling International
- Exhibit 125: Scientific Drilling International - Overview
- Exhibit 126: Scientific Drilling International - Product / Service
- Exhibit 127: Scientific Drilling International - Key offerings
- 10.12 Weatherford International Plc
- Exhibit 128: Weatherford International Plc - Overview
- Exhibit 129: Weatherford International Plc - Business segments
- Exhibit 130: Weatherford International Plc - Key news
- Exhibit 131: Weatherford International Plc - Key offerings
- Exhibit 132: Weatherford International Plc - Segment focus
11 Appendix
- 11.2 Inclusions and exclusions checklist
- Exhibit 133: Inclusions checklist
- Exhibit 134: Exclusions checklist
- 11.3 Currency conversion rates for US$
- Exhibit 135: Currency conversion rates for US$
- 11.4 Research methodology
- Exhibit 136: Research methodology
- Exhibit 137: Validation techniques employed for market sizing
- Exhibit 138: Information sources
- 11.5 List of abbreviations
- Exhibit 139: List of abbreviations
About Technavio Technavio is a leading global technology research and advisory company. Their research and analysis focus on emerging market trends and provide actionable insights to help businesses identify market opportunities and develop effective strategies to optimize their market positions.
With over 500 specialized analysts, Technavio's report library consists of more than 17,000 reports and counting, covering 800 technologies, spanning across 50 countries. Their client base consists of enterprises of all sizes, including more than 100 Fortune 500 companies. This growing client base relies on Technavio's comprehensive coverage, extensive research, and actionable market insights to identify opportunities in existing and potential markets and assess their competitive positions within changing market scenarios.
Contacts Technavio ResearchJesse MaidaMedia & Marketing ExecutiveUS: +1 844 364 1100UK: +44 203 893 3200Email: [email protected] Website:
SOURCE Technavio
MENAFN16082022003732001241ID1104703667
Legal Disclaimer:
MENAFN provides the information “as is” without warranty of any kind. We do not accept any responsibility or liability for the accuracy, content, images, videos, licenses, completeness, legality, or reliability of the information contained in this article. If you have any complaints or copyright issues related to this article, kindly contact the provider above.