(MENAFN- ValueWalk)
As performance trends come and go, investors may wonder whether they should adjust their portfolios accordingly. When prices drop, should they buy the dip in anticipation of prices going back up? Conversely, when prices rise, should they buy the rise in case the climb continues?
Get The Full Henry Singleton Series in PDF
Get the entire 4-part series on Henry Singleton in PDF. Save it to your desktop, read it on your tablet, or email to your colleagues
Q3 2021 hedge fund letters, conferences and more
WSJ Techlive: Greylock's Sarah Guo On Tech Investments

The technology industry has long been on the receiving end of billions of dollars in capital, but what's next for the industry? Greylock General Partner Sarah Guo joined Wall Street Journal reporter Zoe Thomas to talk about the future of tech investment. Q3 2021 hedge fund letters, conferences and more Seed Funding Thomas asked Guo Read More
In this Markets in a Minute from New York Life Investments , we compare these scenarios with following a financial plan to see which one has delivered better returns.
Table of Contents show
-
1.
A Tale Of Three Portfolios
-
2.
Portfolio Values Over Time
-
3.
Risk and Return
-
4.
Buy the Dip: More Effort & More Risk
A Tale Of Three Portfolios
To evaluate these strategies, we compared the historical performance of three hypothetical portfolios:
- Buy the dip: 100% of the portfolio was invested in the worst-performing asset class from the prior year.
- Buy the rise: 100% of the portfolio was invested in the best-performing asset class from the prior year.
- Follow a plan: A balanced portfolio of 60% U.S. large cap stocks and 40% U.S. investment grade bonds for the entire duration.
We considered 13 asset classes to determine the best and worst-performing assets in each year.
| Equities | Fixed Income | Alternatives |
| U.S. Large Cap Stocks | U.S. Taxable Municipal Bonds | Gold |
| U.S. Small Cap Stocks | U.S. Investment Grade Bonds | Equity Real Estate Investment Trusts |
| Developed Market Stocks | U.S. High Yield Bonds | Hedge Funds |
| Emerging Market Stocks | Foreign Bonds | Global Commodities |
| | Cash (U.S. Treasuries) | |
Four were within the broad category of equities , five were under the fixed income umbrella, and four were alternative investments.
Portfolio Values Over Time
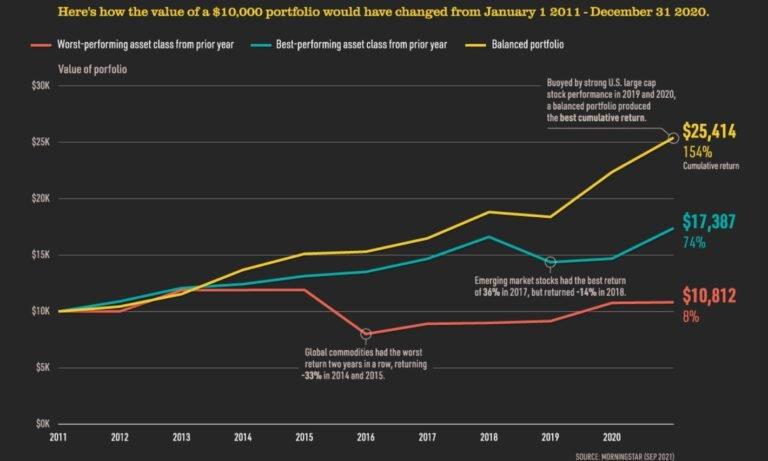
We assumed all three portfolios had the same starting value of $10,000 as of January 1, 2011. Here's how the year-end values of the portfolios would have changed over the last decade.
| | Buy the Dip | Buy the Rise | Follow a Plan |
| 2011 | $10,007 | $10,893 | $10,433 |
| 2012 | $11,890 | $12,076 | $11,541 |
| 2013 | $11,896 | $12,421 | $13,689 |
| 2014 | $11,911 | $13,137 | $15,109 |
| 2015 | $7,997 | $13,509 | $15,301 |
| 2016 | $8,906 | $14,674 | $16,488 |
| 2017 | $8,979 | $16,616 | $18,814 |
| 2018 | $9,142 | $14,368 | $18,386 |
| 2019 | $10,754 | $14,685 | $22,360 |
| 2020 | $10,812 | $17,387 | $25,414 |
The buy the dip portfolio climbed steeply in 2012. Emerging market stocks , the worst-performing asset class in 2011, rebounded the following year with an annual return of 19% . Unfortunately, the buy the dip portfolio saw its value drop significantly in 2015 . Global commodities had the worst return two years in a row, returning -33% in 2014 and 2015. Ultimately, the value of the buy the dip portfolio ended close to where it started, with total gains of just $812.
On the other hand, the buy the rise portfolio saw its worst annual performance in 2018. Emerging market stocks had returned an impressive 36% in 2017, but saw losses the following year. The buy the rise portfolio had its best return in 2020, when U.S. large cap stocks continued their upward climb from the year before. By the end of 2020, the buy the dip portfolio saw gains of over $7,000 .
Finally, the balanced follow a plan portfolio experienced a small drop in 2018 when U.S. large cap stocks declined. However, it climbed the following two years due to a recovery in U.S. large cap stocks, which was the top-performing asset class in 2019. In the end, the balanced portfolio more than doubled its original value—the best performance of the three portfolios we analyzed.
Risk and Return
Of course, return is only one side of the equation. To properly evaluate all three strategies, investors can consider both risk and return .
Below, we look at how risk and return stacked up for each portfolio over the 10 year period.
| | Buy the Dip | Buy the Rise | Follow a Plan |
| Cumulative Return | 8% | 74% | 154% |
| Min Annual Return | -33% | -14% | -2% |
| Median Annual Return | 1% | 7% | 11% |
| Max Annual Return | 19% | 18% | 22% |
| Standard Deviation | 14% | 9% | 7% |
Standard deviation based on annual returns.
Not only did the buy the dip strategy have the lowest cumulative return, it also had the highest risk . For instance, this portfolio experienced the biggest one-year decline of -33%, and had the highest standard deviation of 14%.
In the middle of the pack, the buy the rise portfolio's worst drawdown was -14% and it had a standard deviation of 9%. Notably, its median annual return of 7% was much higher than that of the buy the dip portfolio.
Lastly, the follow a plan portfolio performed well on all fronts. Compared to the other two portfolios, it had the highest cumulative return and the lowest risk. Over the 10 year period, its worst annual performance was a decline of just -2%.
Buy the Dip: More Effort & More Risk
Notably, there are lots of variables that could affect the results of these strategies.
- Time period : Are there general market conditions at play? For example, U.S. large cap stocks had a bull market for most of the period we studied, boosting the return of the balanced portfolio.
- Types of securities : Is the portfolio investing in entire asset classes, or specific companies?
- Short-term or medium-term movements: Is the portfolio tracking daily dips and rises, or annual dips and rises?
However, based on this set of data, buy the dip and buy the rise strategies have historically had lower returns and higher risk than a balanced portfolio. If the market doesn't move in the way the investor predicts, this can result in large drops in the portfolio. It also requires more effort to track these trends, and could result in higher fees from more frequent trading.
In contrast, following a balanced portfolio has historically resulted in lower risk and higher returns. By sticking to a plan, investors are also much more likely to be aligned with where they are on the investor lifecycle . This means their investment choices match up with their goals and risk tolerance.
Article by Visual Capitalist
Updated on Oct 22, 2021, 3:48 pm
MENAFN22102021005205011743ID1103025222
Legal Disclaimer:
MENAFN provides the information “as is” without warranty of any kind. We do not accept any responsibility or liability for the accuracy, content, images, videos, licenses, completeness, legality, or reliability of the information contained in this article. If you have any complaints or copyright issues related to this article, kindly contact the provider above.