US Dollar Forecast: EUR/USD, USD/JPY Look to PMI Data & Yields
Date
5/20/2021 7:12:21 PM
(MENAFN- DailyFX)
US DOLLAR PRICE OUTLOOK: EUR/USD, USD/JPY AWAIT PMI SURVEYS DUE
- The declined -0.5% alongside a pullback in Treasury bond yields on Thursday
- DXY index drilled right back down to critical support after erasing minute gains
- and eye the release of monthly PMI data from IHS Markit due Friday
- Visit the or read up on these US Dollar

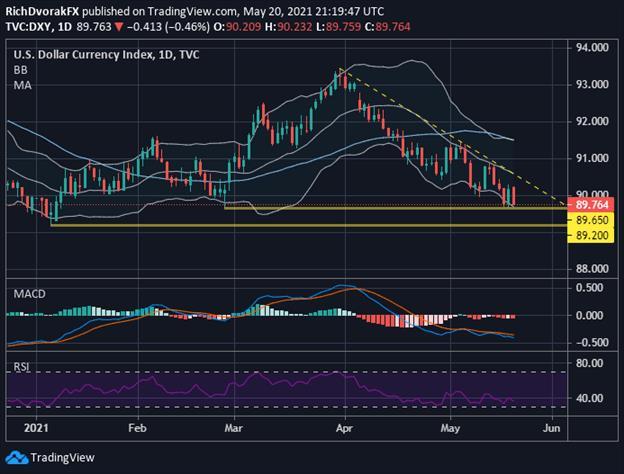
US Dollar bears drove the broader DXY Index -0.5% lower on Thursday. This followed a drop in Treasury yields that completely unwound yesterday’s rise sparked by FOMC minutes, which hinted at the of Fed tapering. Broad US Dollar weakness sent / ripping 50-pips higher to test while USD/ tumbled -0.41% on the session. The DXY Index now hovers back at a key area of technical support near the 89.65-price level.
DXY – US DOLLAR INDEX PRICE CHART: DAILY TIME FRAME (24 DEC 2020 TO 20 MAY 2021)

Chart by created using
US Dollar bulls might look to defend this potential area of buoyancy underpinned by February’s monthly low. The bottom could also help stymie US Dollar selling pressure. To that end, the DXY Index arguably is starting to look oversold here judging by the . US Dollar rebound potential brings the 20-day simple and descending into focus.

Eclipsing last week’s high around 90.80 might open up the door to test the 50-day simple moving average and upper Bollinger Band. On the other hand, another round of US Dollar weakness might steer the DXY Index toward the 89.20-price level where year-to-date lows reside. Taking out that level of may see US Dollar bears set their sights on 2018 swing lows deep into the 88.00-handle. This could confirm the ominous descending triangle that appears to be forming on the DXY Index.
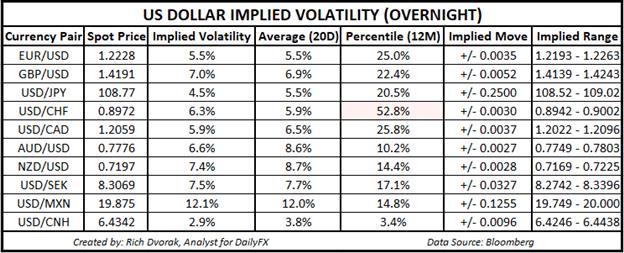
USD PRICE OUTLOOK – US DOLLAR IMPLIED VOLATILITY TRADING RANGES (OVERNIGHT)

Looking ahead to Friday’s trading session on the , we see notable event risk posed by the scheduled release of PMI surveys by IHS Markit. Though overnight US Dollar readings suggest that are expected to have relatively little movement. EUR/USD overnight implied volatility of 5.5%, for example, ranks in the bottom 25th percentile of measurements taken over the last 12-months.

Likewise, USD/JPY overnight implied volatility of 4.5% is below its 20-day average reading of 5.5% and ranks in the bottom 20th percentile of readings over the last year. If US PMI data emphasizes persistent supply chain disruptions and corresponding price pressures, however, could accelerate alongside a sharp spike higher in Treasury yields as markets grow more fearful of inflation and the risk of Fed tapering.
Keep Reading –
-- Written by , Analyst for
Connect with on Twitter for real-time market insight
MENAFN20052021000076011015ID1102107655

Legal Disclaimer:
MENAFN provides the information “as is” without warranty of any kind. We do not accept any responsibility or liability for the accuracy, content, images, videos, licenses, completeness, legality, or reliability of the information contained in this article. If you have any complaints or copyright issues related to this article, kindly contact the provider above.