(MENAFN- DailyFX)
NASDAQ 100, NIKKEI 225, ASX 200 INDEX OUTLOOK:
- , and 100 closed -0.16%, -0.25%, and -0.60% respectively
- climbed to three-and-half month high as the US Dollar index fell
- extended higher amid demand optimism; tumbled to a three-month low
- The and indexes traded higher, setting a positive tone for APAC markets

Wall Street, Inflation, Gold, , Bitcoin, Asia-Pacific at Open:
The technology sector pulled Wall Street equity benchmarks slightly lower on Monday as investors mulled rising inflation concerns and a Covid-19 resurgence in Asia. The Nasdaq 100 index fell 0.6%, dragged by Tesla (-2.19%), Microsoft (-1.2%) and Apple (-0.93%). The 5-year breakeven rate – a key gauge of bond traders’ inflation expectations – has reached a multi-year high of 2.768%. This suggests that the inflation outlook remains robust as tightened labor market conditions boosted wage growth and rising commodity prices fueled price gains.
Meanwhile, Taiwan reported a spike in Covid-19 cases over the weekend while Singapore returned to quasi-lockdown on Sunday. Escalating pandemic situations in parts of Asia point to a delay in economic reopening and stricter border controls, hinting at a slower pace of recovery.
Rising demand for safety and inflation-hedge assets sent gold prices to a three-and-half month high of US$ 1,866. The after the government eased a quota on gold imports may lend support to prices in the medium term.Crude oil prices edged higher as the summer driving season and a robust recovery in the US brightened the outlook for demand. Energy was the best-performing S & P 500 sector overnight.
Bitcoin extended lower after Elon Musk- the founder of Tesla- hinted on Twitter that the company may have sold or could soon sell its Bitcoin holdings. Prices fell to $ 43,800 – the lowest level seen in more than three months.
Top 10 Stock by Market Cap in the Nasdaq 100 – Daily Performance
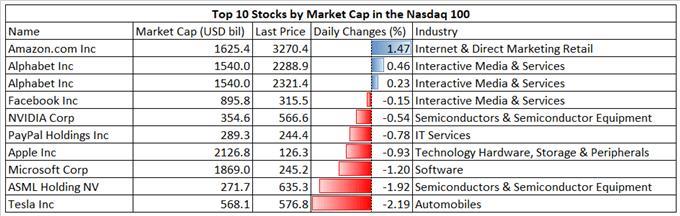
Source: Bloomberg, DailyFX
Asia-Pacific markets look set to trade broadly higher on Tuesday. Futures in Japan, mainland China, Australia and Hong Kong are in the green. Technology shares in the region could face headwinds following a sour lead on Wall Street, whereas the energy, materials and financial sectors may show resilience.
Japanese Q1 GDP shrank at an annualized rate of -5.1%, more than a baseline forecast of -4.6%. A poorer-than-expected reading may undermine sentiment for the Nikkei 225 index. Looking ahead, the RBA meeting minutes and UK employment change dominate the economic docket alongside US housing starts. Find out more from the .

Nasdaq 100 IndexTechnical Analysis
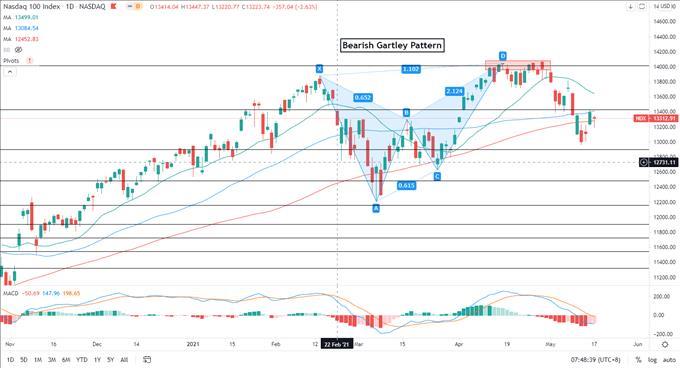
The Nasdaq 100 index has likely formed a bearish Gartley 222 pattern and traded lower since (chart below). The ''D” point coincides with the 200% Fibonacci extension level (14,013), therefore serving as a strong resistance level. An immediate support level can be found at 12,900 (the 127.2% Fibonacci extension), whereas an immediate resistance level can be seen at 13,430 (the 161.8% extension). The MACD indicator is trending lower but the signal lines is converging with the MACD line, suggesting that downward momentum may be fading.
Nasdaq 100 Index– Daily Chart
Nikkei 225 Index Technical Analysis:
The Nikkei 225 index breached a key support level at 28,357 (the 100% Fibonacci extension. This level now turns to an immediate resistance. The 20- and 50-day SMA lines are about to cross below the 100-day line, potentially forming a ''Death Cross”. The MACD indicator is trending lower, suggesting that further consolidation is likely.
Nikkei 225 Index – Daily Chart

ASX 200 Index Technical Analysis:
The ASX 200 index pulled back from record highs after a failed attempt to breach the 261.8% Fibonacci extension level at 7,126. Prices have also breached below a '' ”, hinting at further downside potential with an eye on 6,920 (the 50-day SMA) for support. The MACD indicator formed a bearish crossover and trended lower, suggesting that upward momentum may be fading.
ASX 200 Index – Daily Chart


--- Written by Margaret Yang, Strategist for DailyFX.com
To contact Margaret, use the Comments section below or on Twitter
MENAFN17052021000076011015ID1102094343
Legal Disclaimer:
MENAFN provides the information “as is” without warranty of any kind. We do not accept any responsibility or liability for the accuracy, content, images, videos, licenses, completeness, legality, or reliability of the information contained in this article. If you have any complaints or copyright issues related to this article, kindly contact the provider above.