(MENAFN- DailyFX)
Nasdaq Price, News, and Analysis:
- slump leads global equity markets lower.
- US inflation fears weigh on tech stocks.
Equity markets are a sea of red in early turnover after the Nasdaq 100 and the Japanese recorded sharp losses overnight. The Nasdaq closed over 2.5% lower in the US, and ominously close to its low of the day, while the Nikkei closed just over 3% lower. These losses have been extended in Europe.

The top Nasdaq companies recorded losses across the board with Apple (AAPL) down 2.6%, Microsoft (MSFT) down 2.1%, Amazon (AMZN) ended just over 3% in the red, while Tesla (TSLA) slumped by 6.4%.
DailyFX analyst Rich Dvorak noted the potential for Tesla volatility in this article at the weekend.
The tech sector is being hit by renewed fears of US inflation, despite last week’s weak US Jobs Report. A closely followed indicator of future inflation trends, the 5-year breakeven inflation rate, is currently at a multi-year high of 2.71%, a level that will cause concern for Fed chair Jerome Powell. Soaring commodity prices will have been noted, with many industrial metals hitting multi-year or all-time highs over the last few days. The Fed’s current line is that they will look through any short-term rise inflation, but with price pressures continuing to rise, the question is when not if, they will drop this stance and look at tightening monetary policy.

On Wednesday, inflation will again be in the spotlight with the release of US core inflation (April) which on a year-on-year basis is expected to rise to 3.6% from 2.6% in the prior month. Traders should also be aware that there are also five Fed speakers today and their commentary needs to be closely followed. For all market-moving economic data and events, see the
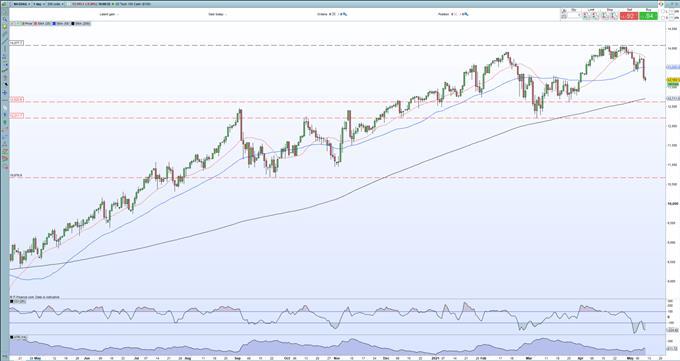
The Nasdaq’s recent cluster of highs around 14,070 is unlikely to be breached anytime soon after yesterday’s sell-off broke below the 50-day moving average with ease. The multi-month trend of higher lows has yet to be broken and may offer support around 12,623, with this low guarded by the 200-day simple moving average at 12,711.
Nasdaq 100 (NDX) Daily Price Chart (April 2020 – May 11, 2021)

What is your view on the Nasdaq– bullish or bearish?? You can let us know via the form at the end of this piece or you can contact the author via Twitter .
MENAFN11052021000076011015ID1102063282
Legal Disclaimer:
MENAFN provides the information “as is” without warranty of any kind. We do not accept any responsibility or liability for the accuracy, content, images, videos, licenses, completeness, legality, or reliability of the information contained in this article. If you have any complaints or copyright issues related to this article, kindly contact the provider above.