(MENAFN- DailyFX)
US Dollar, EUR/USD, GBP/USD, USD/CAD Talking Points:
- It was a big week for USD , capped off by a disappointing NFP report .
- US Dollar bears remain in-control and this has helped EUR/USD to pop up to a key resistance zone. USD/CAD continues to fall as that USD-weakness is matched up with what's been a very strong Canadian Dollar .
Advertisement
It was a big week for the US Dollar. After a strong push by bulls last Friday, the Greenback came into this week with some bullish short-term potential . This follows a month of April that was very bearish in the currency, with sellers driving the same trend that was so prominent in the back nine months of 2020 trade.
But, after a strong Q1, USD reversed at the Q2 open and continued to fall, all the way into the final trading day of April at which point that push of strength developed. But that high from last Friday came in at a key point of resistance: And that resistance held through the first couple days of this week, as I had shared in the Tuesday webinar .
But after price action built-in an evening star formation on the Daily chart from Tuesday through Thursday, the stage was set for Non-farm Payrolls and a disappointing print there brought even more sellers into the mix, driving the USD to a fresh two-month-low. At this point, the US Dollar is testing a trendline that can be found by connecting January and February swing lows. This may stall that near-term bearish move temporarily.
To learn more about evening star formations or trendlines , check out DailyFX Education
US Dollar Daily Price Chart

Chart prepared by James Stanley ; USD, DXY on Tradingview
US Dollar Bigger Picture
I remain bearish on the US Dollar for a number of reasons, both fundamental and technical. As I share in my webinars, this doesn't mean that I'm going to take a one-sided approach on the matter, as I'll often look to position into pairs appropriately to balance the risk. I had looked into a similar approach in that webinar on Tuesday, plotting for USD-weakness in EUR /USD and USD/CAD.
But, bigger picture, I remain bearish, as well, and I had shared those reasons in the Q2 Technical Forecast for the US Dollar , which you can access in-full from the below link. The chart that was driving that analysis is shared below, from the monthly variety of USD.

US Dollar Monthly Price Chart

Chart prepared by James Stanley ; USD, DXY on Tradingview
EUR/USD: Falling Wedge Reversal into Key Resistance
On the short-side of the US Dollar, EUR/USD put in some work this week.
The pair had pushed down to the 1.2000 psychological level on the heels of that Friday strength in the USD. But, along the way, the pair built into a falling wedge formation, often followed with the aim of bullish reversals. That filled in this week with prices quickly reverting to a big zone of confluent resistance, running from 1.2134-1.2167.
This brings breakout potential into the pair, looking for a push up to a fresh two-month-high to potentially offer some extended run. Alternatively, higher-low support potential could be sought out around 1.2072, as this was a quick swing-high/swing-low; and if the US Dollar is stretched and due for a bounce, that 2072 price could be an attractive area for bulls to show higher-low support.
EUR/USD Eight-Hour Price Chart
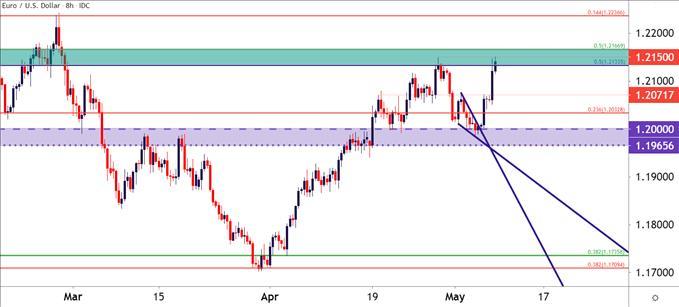
Chart prepared by James Stanley ; EURUSD on Tradingview
GBP/USD: Can Cable Finally Get that 1.4000 Print?
Coming into the year I had looked at GBP/USD as one of the more operable bearish-USD scenarios. The pair had run cleanly within a bullish channel for much of the prior six months, but that broke down in late-February and GBP /USD was unable to test above the 1.4000 level after.
Since, there's been more than five different rejections at this price, most recently a few weeks ago. For those that are looking for fades in USD, this could present a compelling option for now. But if/when that 1.4000 spot gets taken-out, the door for additional upside also opens and this could be a fast topside breakout once that psychological level is traded through.
To learn more about psychological levels , check out DailyFX Education
GBP/USD Four-Hour Price Chart
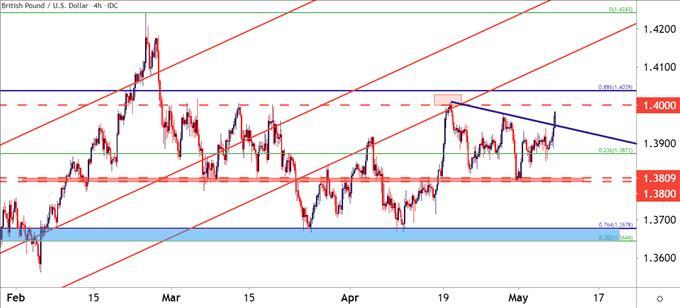
Chart prepared by James Stanley ; GBPUSD on Tradingview
USD/CAD for USD-Weakness Scenarios: Timber!
I had also looked at USD/CAD for weakness scenarios in that Tuesday webinar, pointing to the recent shift at the Bank of Canada as a key reason for staying on the bearish side of the pair.
Even as the Fed continues to talk up low rates for longer, the Bank of Canada has become one of the first major Central Banks to begin looking at post-pandemic policy. That helped the Canadian Dollar to get fairly strong, and when meshed up with USD-weakness, this allowed for bearish trend potential going into the Non-farm Payrolls report.
The pair has since plummeted down to a fresh three-year-low, and is making a fast move towards the six-year-low lodged just above the 1.2000 psychological handle. For next week, the 1.2250 area remains of interest for lower-high resistance.
USD/CAD Weekly Price Chart
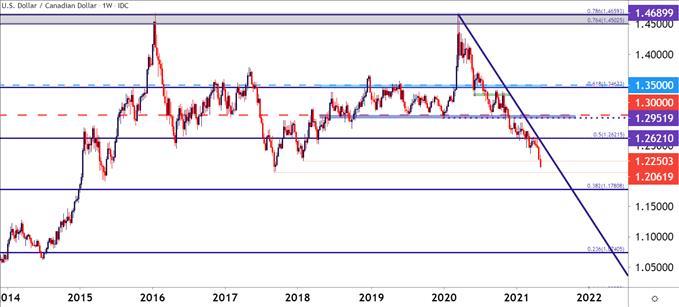
Chart prepared by James Stanley ; USDCAD on Tradingview
--- Written by James Stanley, Senior Strategist for DailyFX.com
Contact and follow James on Twitter: @JStanleyFX
MENAFN07052021000076011015ID1102046260
Legal Disclaimer:
MENAFN provides the information “as is” without warranty of any kind. We do not accept any responsibility or liability for the accuracy, content, images, videos, licenses, completeness, legality, or reliability of the information contained in this article. If you have any complaints or copyright issues related to this article, kindly contact the provider above.