(MENAFN- DailyFX)
Dogecoin, Bitcoin Talking Points
- The crypto craze has remained in full force this week as the Coinbase IPO grabbed headlines market-wide.
- Both Bitcoin and Ethereum set fresh all-time-highs, but it was Dogecoin that stole the show with a parabolic-like move that's entailed more than 549%, this week alone.
- The analysis contained in article relies on price action and chart formations . To learn more about price action or chart patterns, check out our DailyFX Education section.
Advertisement
It was a big week for the crypto space as the Coinbase IPO took markets by storm. But this wasn't the only noise out of crypto as both Bitcoin and Ethereum launched up to fresh all-time-highs . Surprisingly, neither was the most interesting thing going on this week in that space, as Dogecoin put in an astonishing run of more than 549% from the Monday low up to the Friday high.

You may recall Dogecoin as being one of the markets cited by Elon Musk of recent. Unlike Bitcoin , Dogecoin has an unlimited supply and was in essence, created as a meme. But in 2021 so far, the coin has attracted considerable attention, rising from a low less than one cent in late-January to trade above .44 cents this morning. That entails a run of 5,955% in just a few months.
These astonishing moves, while interesting, are incredibly difficult to put any actual analysis behind given that we're seeing a near-parabolic like trend. The big question at that point for the trader is whether or not they think that will continue, and given the rapid pace of the move, there's a dearth of evidence in either direction that could create a compelling analytical argument.

Dogecoin Daily Price Chart
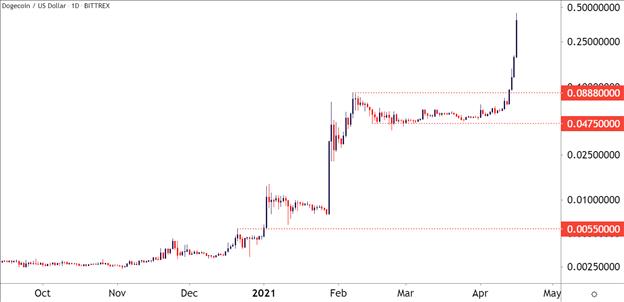
Dogecoin price chart created using TradingView
Bitcoin Breaks Out, Pulls Back to Support at Prior Resistance
It was another big week for Bitcoin, well, at least to start off with, as BTC/USD jumped to yet another fresh all-time-high ahead of this week's Coinbase IPO listing. The big item from that breakout was the cryptocurrency crossing the psychological 60k threshold, a price that had held resistance for about a month from mid-March into mid-April. I had expressed the potential of a bullish breakout in last week's analysis , highlighting a brewing symmetrical triangle pattern that had built as price action was holding below the 60k psychological level.
To learn more about psychological levels or symmetrical triangles , check out DailyFX Education
The breakout took hold ahead of the Coinbase IPO earlier this week, and Bitcoin rushed up to another fresh all-time-high at the 64,895 level, coming very close to engaging with the next psychological level of 65k. Bulls were unable to test that price, however, and a pullback showed up and held through Thursday trade.
At this point, prices in Bitcoin are testing support at prior resistance, right around that same 60k level that previously helped to hold the highs. From the below four-hour chart, you can see where this morning's low shows around that big batch of prior resistance. This can keep the door open for bulls looking for topside trend continuation, however, timing may have a wrinkle to contend with that we'll look at on a later chart.

Bitcoin (BTC/USD ) Four-Hour Price Chart
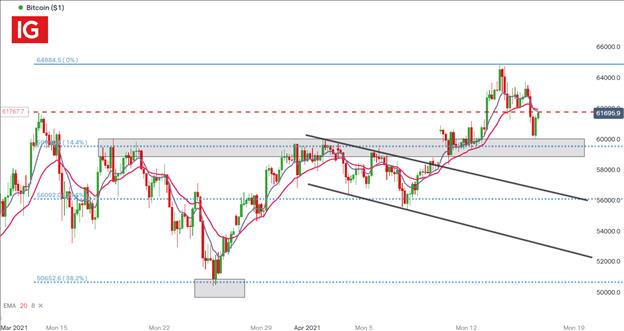
Chart prepared by Tammy Da Costa , IG
One of the biggest challenges of trading an aggressively bullish market is short-term timing. This week saw incredible interest build around the crypto theme, helped along by the public listing of Coinbase. But Bitcoin had held below 60k for almost a month, and this week's breakout has pulled back quite a bit in just a couple of days.
If this 60k level cannot hold as support, sellers may be able to drive a bit deeper on the chart.
On the below hourly chart, we're seeing a progression of lower-lows and lower-highs that has not yet shown signs of stopping. A big level of possible resistance is nearing, taken from around the prior all-time-high of 61,781. This price had functioned as short-term support on Wednesday; but buyers were unable to stem the tide of selling as prices scaled back to that 60k threshold. So for Bitcoin bulls, a breach back above this level can be seen as a bullish signal, whereas bears may be looking to focus on a continued progression of lower-lows and highs should this resistance level help to keep bears in-control.

Bitcoin (BTC/USD) Hourly Price Chart
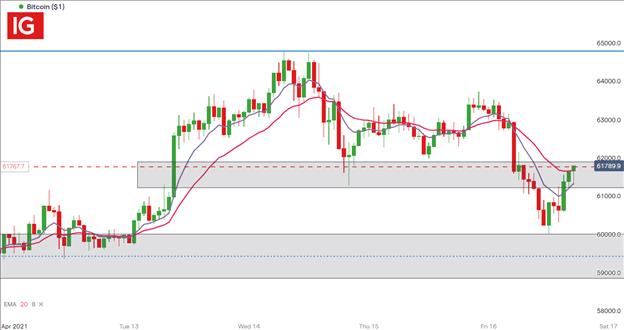
Chart prepared by Tammy Da Costa , IG
--- Written by Tammy Da Costa, Market Writer for DailyFX.com
Contact and follow Tammy on Twitter: @Tams707
MENAFN16042021000076011015ID1101931470
Legal Disclaimer:
MENAFN provides the information “as is” without warranty of any kind. We do not accept any responsibility or liability for the accuracy, content, images, videos, licenses, completeness, legality, or reliability of the information contained in this article. If you have any complaints or copyright issues related to this article, kindly contact the provider above.