(MENAFN- DailyFX)
NASDAQ 100, HANG SENG, ASX 200 INDEX OUTLOOK:
- Dow Jones , S & P 500 and Nasdaq 100 closed +0.16%, -0.41% and -1.31% respectively
- Coinbase swung sharply lower after debut, pulling Bitcoin and technology shares broadly lower
- Futures in Australia and Hong Kong are positioned for losses following a sour lead
Coinbase, Powell Speech, Earnings, Asia-Pacific at Open:
The Nasdaq 100 index pulled back from its all-time high as the debut of Coinbase one of the largest cryptocurrency exchanges closed sharply lower after debut. The price of the stock fell 23% from its intraday high of $428.9 and closed at $328.0, but still well above the IPO reference price of $250. Substantial selling pressure observed on its IPO day pulled Bitcoin prices off its all-time highs and dented sentiment across the technology sector. This may cast a shadow over Asia Pacific markets at open.
Energy and financial stocks outperformed on Wall Street overnight, buoyed by higher crude oil prices and upbeat bank earnings. Goldman Sachs and Wells Fargo surged 2.3% and 5.5% respectively as they reported earnings that beat expectations. JP Morgan fell 1.9% however, after its CEO Jamie Dimon painted a challenging picture of loan demand.
Fed Chair Jerome Powell reiterated his dovish stance during a speech at the Economic Club of Washington on Wednesday, emphasizing that the central bank will taper its asset purchasing program 'well before any interest rate increase. Federal Reserve Bank of Dallas President Robert Kaplan said the recent rise in Treasury yields was 'natural, not alarming, and that's a sign of an improving economy, and therefore he would oppose a Fed intervention to contain those rates.
The DXY US Dollar index fell 0.21% to 91.61, extending its downward trajectory formed since early April as market digested a slew of speeches from Fed officials. A weaker US Dollar may support precious metals and commodity prices, and buoy emerging market currencies and equities.
Coinbase 5 mins Chart
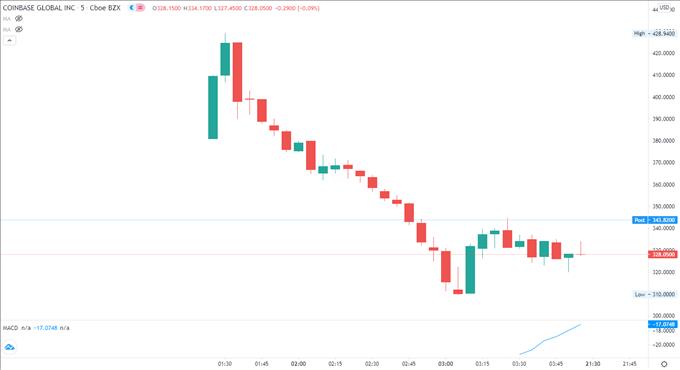
Chart by TradingView
Asia-Pacific markets are poised for a mixed start on Thursday, with futures across Japan, Australia, Hong Kong, Taiwan, Singapore, India and Thailand pointing to open lower. Those in mainland China, South Korea, Singapore and Malaysia are slightly in the green.
The Hang Seng Index (HSI) looks set to pull back slightly after gaining 1.42% on Wednesday, as Coinbase's lackluster debut may dampen sentiment for technology shares. The index attempted to turn higher after Chinese antitrust regulators imposed a record $2.8 billion fine on Alibaba.
Australia's ASX 200 index opened down -0.34%, dragged by healthcare (-0.86%), utilities (-0.70%) and information technology (-0.53%) sectors, whereas materials (+0.94%) and energy (+0.30%) outperformed.
On the macro side, Australian employment data headlines the economic docket alongside German inflation and US retail sales figures. The US weekly jobless claims data will also be eyed for clues about the health of the labor market. Find out more from theDailyFX calendar .
Looking back to Wednesday's close, 5 out of 11 S & P 500 sectors ended higher, with 51.1% of the index's constituents closing in the green. Energy (+2.91%), financials (+0.66%) and materials (+0.64%) were among the best performers, while consumer discretionary (-1.17%) and information technology (-1.15%) trailed behind.
S & P 500 Sector Performance 14-04-2021
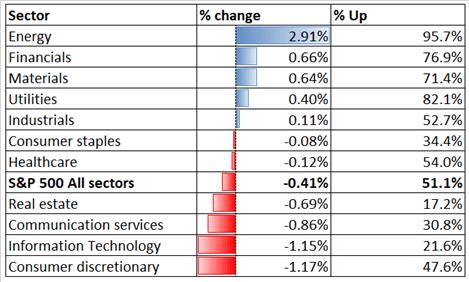
Source: Bloomberg, DailyFX

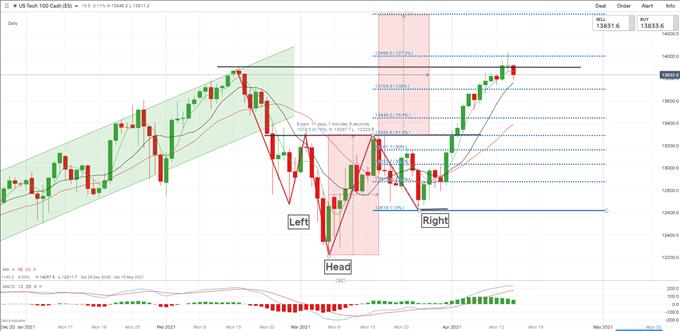
Nasdaq 100 Index Technical Analysis
The Nasdaq 100 index has likely formed an inverse 'Head and Shoulders pattern, which may serve as a strong bullish reversal indicator. The index surpassed its previous high before pulling back, suggesting that 13,900 remains a strong near-term resistance. A solid break above this level would likely intensify near-term buying pressure and open the door for further upside potential towards 14,000 the 127.2% Fibonacci extension. The MACD indicator is flattening, suggesting that upward momentum is fading.
Nasdaq 100 Index Daily Chart
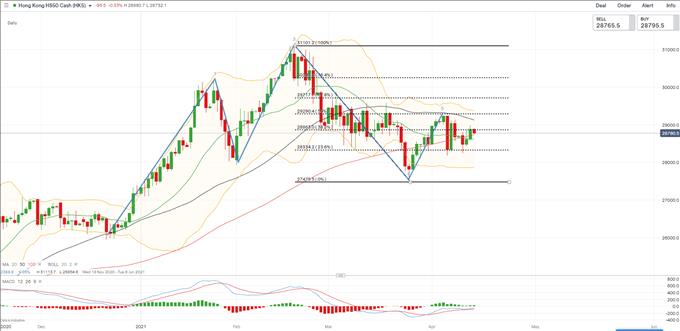
Hang Seng Index Technical Analysis:
The Hang Seng Index (HSI) has likely formed a 'Head and Shoulders chart pattern, which serves as a bearish trend-reversing indicator. There could be more downside room if the pattern completes. An immediate resistance level can be found at the 50-day SMA line (29,119), whereas an immediate support level can be found at 28,334 the 23.6% Fibonacci retracement. The MACD indicator is trending higher beneath the neutral midpoint, suggesting that bullish momentum is building.
Hang Seng Index Daily Chart
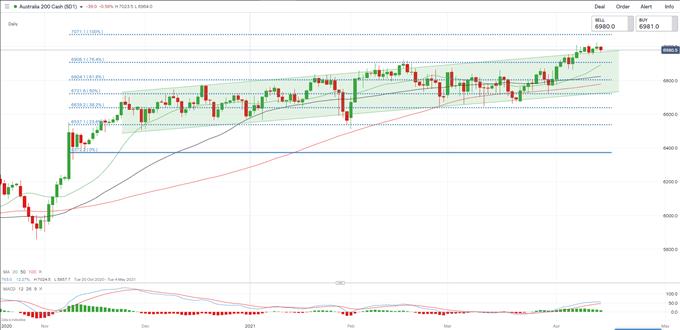
ASX 200 Index Technical Analysis:
The ASX 200 index breached above the ceiling of the 'Ascending Channel and moved forward to test a psychological resistance at 7,000. A daily close above 7,000 would likely intensify near-term buying pressure and pave the way for further upside potential towards 7,071 the 100% Fibonacci extension. The MACD indicator is trending higher above the neutral midpoint, suggesting that buying pressure is building up.
ASX 200 Index Daily Chart

--- Written by Margaret Yang, Strategist for DailyFX.com
To contact Margaret, use the Comments section below or @margaretyjy on Twitter
MENAFN14042021000076011015ID1101918211
Legal Disclaimer:
MENAFN provides the information “as is” without warranty of any kind. We do not accept any responsibility or liability for the accuracy, content, images, videos, licenses, completeness, legality, or reliability of the information contained in this article. If you have any complaints or copyright issues related to this article, kindly contact the provider above.