(MENAFN- DailyFX) Advertisement US Dollar Outlook:
- The US Dollar (via the DXY Index) continues to contend with its pandemic trendline, a magnet for price action throughout February.
- The January US durable goods orders report on Thursday and the January US inflation rate (PCE) report on Friday are the top data releases in the coming days, while Fed Chair Powell's testimony on Capitol Hill will bring the usual fireworks.
- The IG Client Sentiment Index suggests that USD/JPY has a bearish bias.
US Dollar Looking for Direction
The US Dollar (via the DXY Index) continues to contend with its pandemic trendline, a magnet for price action throughout February. Potent catalysts are few and far between over the coming days, with the January US durable goods orders report due on Thursday and the January US inflation rate (PCE) report due on Friday. There's little else (data-wise) that will help define price action beyond the weekly US jobless claims figures.
Meanwhile Fed Chair Jerome Powell's testimony on Capitol Hill will bring the usual commentary from recent public appearances: he'll posture for more fiscal stimulus, and he'll downplay inflation threats.

Federal Reserve Interest Rate Expectations (February 22, 2021) (Table 1)
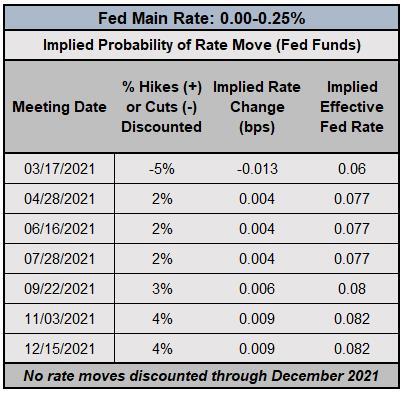
In delivering the semi-annual Monetary Policy Report to Congress, the Fed Chair is very likely to use his time on Capitol Hill to soothe concerns that the rise in US Treasury yields is foreshadowing harrowing levels of inflation. Fed Chair Powell may very well acknowledge that inflation could rise, but the Fed seems poised to ‘look through' any uptick in the near-term.
Even as the US Treasury yield curve has steepened over the past month, market participants don't foresee any acceleration in the Fed's efforts to normalize policy (96% chance of no change by end of 2021).
Read more: Weekly Fundamental US Dollar Forecast: Mr. Powell Goes to Washington

Atlanta Fed GDPNow 1Q'21 Growth Estimate (February 18, 2021) (Chart 1)
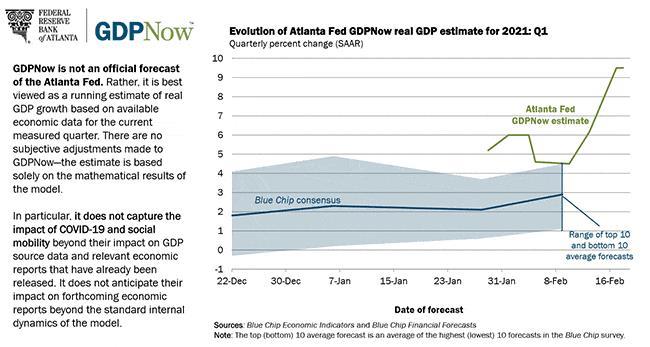
Based on the data received thus far about 1Q'21, the Atlanta Fed GDPNow forecast is looking for growth at +9.5% annualized. The estimate has risen sharply in recent weeks, from +4.5% in early-February, bolstered by a much better than expected January US retail sales report.
The next 1Q'21 Atlanta Fed GDPNow forecast will be released on Thursday, February 25 after the January US durable goods orders report (which has a chance to surprise to the topside like the aforementioned retail sales report).
DXY PRICE INDEX TECHNICAL ANALYSIS: DAILY CHART (February 2020 to February 2021) (CHART 2)

The DXY Index is barely holding above the downtrend from the March and November 2020 highs, but downside pressure has been pronounced amid a three-day losing streak.
A fresh low was set for February at the start of the week, confirming the series of lower highs and lower lows throughout the month. Breaking the late-January swing low at 90.05 would suggest a false bullish breakout and a deeper setback likely to emerge.
Bearish momentum is gathering pace. The DXY Index is below its daily 5-, 8-, 13-, and 21-EMA envelope, which is in bearish sequential order. Daily Slow Stochastics are dipping back into oversold territory, while daily MACD is trending lower below through its signal line.
A drop back below the March and November 2020 downtrend the pandemic trendline would be a significant technical setback for the DXY Index (89.75 at the end of the week).
USD/JPY RATE TECHNICAL ANALYSIS: DAILY CHART (February 2020 to February 2021) (CHART 3)

Even as US Treasury yields have surged higher in recent days, USD /JPY rates have not followed; this is atypical. It's even more atypical considering how strong the Nikkei 225 has been in recent weeks. More on that at another time, though.
To an extent, rising US yields may stem a significant drop in the pair, particularly as USD/JPY approaches the rising trendline from the intrayearly swing lows. The recent advance in USD/JPY was rejected at the underside of the rising trendline from the March and September 2020 lows, itself a magnet for price action throughout November and early-December 2020.
More consolidation may be ahead for the pair even in the event of a rebound, as the descending trendline from the June 2015 and September 2018 highs comes in overhead just above 106.00 through March 2021.
But if USD/JPY were to lose the intrayearly uptrend in the coming days, even against the backdrop of higher US yields, then traders may want to be on alert for a breakdown in the DXY Index.

IG Client Sentiment Index: USD/JPY RATE Forecast (February 22, 2021) (Chart 4)
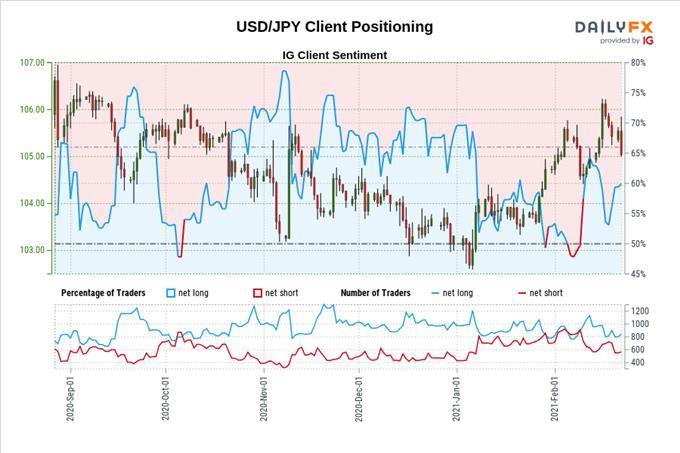
USD/JPY: Retail trader data shows 62.50% of traders are net-long with the ratio of traders long to short at 1.67 to 1. The number of traders net-long is 16.98% higher than yesterday and 2.11% lower from last week, while the number of traders net-short is 2.39% higher than yesterday and 15.20% lower from last week.
We typically take a contrarian view to crowd sentiment, and the fact traders are net-long suggests USD/JPY prices may continue to fall.
Traders are further net-long than yesterday and last week, and the combination of current sentiment and recent changes gives us a stronger USD/JPY-bearish contrarian trading bias.
--- Written by Christopher Vecchio, CFA, Senior Currency Strategist
MENAFN22022021000076011015ID1101644027
Legal Disclaimer:
MENAFN provides the information “as is” without warranty of any kind. We do not accept any responsibility or liability for the accuracy, content, images, videos, licenses, completeness, legality, or reliability of the information contained in this article. If you have any complaints or copyright issues related to this article, kindly contact the provider above.