(MENAFN- DailyFX)
'Is there a best time frame to tradeforex ?' is a common question a lot of traders ask, especially those new to the forex market. The truth is, there is no single answer. It all depends on your preferredtrading strategyandstyle .
Traders utilize varying time frames to speculate in theforex market . The two most common are long- and short-term-time frames which transmits through to trend and trigger charts. Trend charts refer to longer-term time frame charts that assist traders in recognizing the trend, whilst trigger chart pick out possible trade entry points. This article will explore these forex trading time frames in depth, whilst offering tips on which can best serve your trading goals.
Talking points:
- How to decide the best time frame to trade forex
- What are the main forex time frames
- Using multiple time frame analysis
How to decide the best time frame to trade forex-p
p-As mentioned above, the best time frame to trade forex will vary depending on the trading strategy you employ to meet your specific goals. The table below summarizes variable forex time frames used by different traders for trend identification and trade entries, which are explored in more depth below:
| CHART | DAY TRADING | SWING TRADING | POSITION TRADING |
| TREND CHART | Hours to Daily | Weekly to Monthly | Monthly to Yearly |
| TRIGGER CHART | Seconds to Minutes | Hours to Daily | Daily to Weekly |
Main forex trading time frames
Traders utilize different strategies which will determine the time frame used. For example, a day trader will hold trades for a significantly shorter period than that of a swing trader. Read our guide for a basic introduction to differenttrading styles .
1) Position trading time frames
The position trading time frame varies for different trading strategies as summarized in the table above. This could fluctuate from daily to yearly under the 'long-term' definition.
Many new traders tend to avoid this approach because it means long periods of time before trades are realized. However, by many accounts, trading with a shorter-term (day trading) approach can be far more problematic to execute successfully, and it often takes traders considerably longer to develop their strategy.
Position trading (longer-term) approaches can look to the monthly chart for gradingtrends , and the weekly chart for potential entry points.
Position trading example
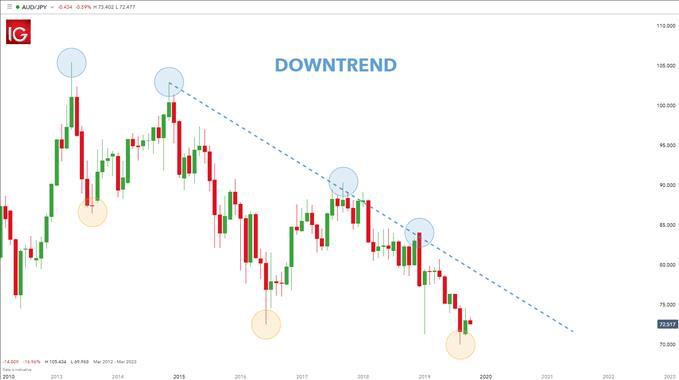
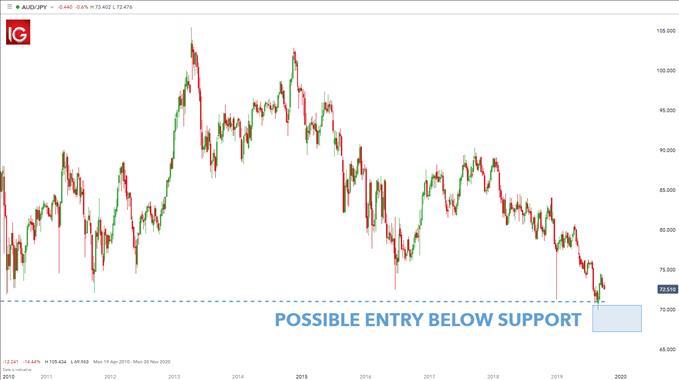
After the trend has been determined on the monthly chart (lower highs and lower lows), traders can look to enter positions on the weekly chart in a variety of ways. Many traders look to utilize price action (as seen in the weekly chart below) for determining trends and/or entering positions, but indicators can absolutely be utilized here as well.
MonthlyAUD/JPYtrend chart:
-p
p-WeeklyAUD/JPYtrigger chart:
2) Swing trading time frames
After a trader has gained comfort on the longer-term chart, they can then look to move slightly shorter in their approach and desired holding times. This can introduce more variability into the trader's approach, so risk and money management should be addressed before moving down to shorter time frames.
Swing tradingis a happy medium between a long-term trading time frame and a short-term, scalping approach. One of the best benefits of swing trading is that traders can get the benefits of both styles without necessarily taking on all the downsides. As a result, this makes swing trading a very popular approach to the markets.
Swing traders will check the charts a couple times per day in case any big moves occur in the marketplace. This affords traders the benefit of not having to watch markets continuously while they're trading. Once an opportunity is identified, traders place the trade with astopattached and monitor at a later stage to see the progress of the trade.
Another advantage of this approach is that the trader is still looking at charts often enough to seize opportunities as they exist. This eliminates one of the downsides of longer-term trading in which entries are generally placed on the weekly/daily charts.
Swing trading example
For this approach, the daily chart is often used for determining trends or general market direction and the four-hour chart is used for entering trades and placing positions (see below). The daily chart shows the recent swing high and low respectively. Traders usually trade swings back in the direction of the preceding trend – in this example the preceding trend is upwards.
Now that the trade direction has been identified, the swing trader will then diminish the time frame to four-hours to look for entry points. In the example below, there is a clear price resistance level that the swing trader will look at when entering a long trade. Once price breaks or the candle closes above the designated resistance level, traders can look to enter.
DailyUSD/ZARtrend chart:

-p
p-4-hourUSD/ZARtrigger chart:

-p
p-3) Day trading time frames
Day trading can be one of the most difficult strategies of finding profitability. Newer traders implementing a day trading strategy are exposing themselves to more frequent trading decisions that may not have been practiced for very long. This combination of experience and frequency opens the door for losses that might have been prevented had the trader opted for a slightly longer approach like swing trading.
The scalper or day trader is in the unenviable position of needing the price to move quickly in the direction of the trade. Therefore, the day trader becomes tied to the charts as they seek the market's trends for that day. Obsessing over charts for long periods of time can lead to fatigue. The shorter-term approach also affords a smaller margin of error.
Generally, there is less profit potential in short-term trading which leads to tighter stops levels. These tighter stops mean higher probability of failed trades as opposed to longer-term trading.To trade with a very short-term approach, it's advisable for a trader to get comfortable with a longer-term, and swing-trading approach before moving down to the very short time frames.
Resembling longer-term trading, day traders can look to evaluate trends on the hourly chart and locate entry opportunities on the 'minute' time frames such as five or ten-minute charts. The one-minute time frame is also an option, but extreme caution should be used as the variability on the one-minute chart can be very random and difficult to work with. Once again, traders can use a variety of triggers to initiate positions once the trend has been determined -price actionortechnical indicators .
Day trading example
The charts below use the hourly chart to determine the trend – price below200-day moving averageindicating a downtrend. The second 10-minute chart uses theRSI indicatorto assist in short-term entry points. In this case, the trader only identifies overbought signals on the RSI (highlighted in red) because of the longer-term preceding downtrend.
HourlyEUR/USDtrend chart:

10-minuteEUR/USDtrigger chart:

Using multiple time frame analysis
The best time frame to trade forex does not necessarily mean one specific time frame. It is possible to combine approaches to find opportunities in the forex market. Find out more in our guide tomultiple time frame analysis .
Further reading on forex technical analysis
- Get to grips with thebasics of forex time framesto enhance your trading strategy.
- If you'renew to forextrading, download ourForex for Beginners Trading guide for an expert overview of the market.
MENAFN0910201900760000ID1099106231
Legal Disclaimer:
MENAFN provides the information “as is” without warranty of any kind. We do not accept any responsibility or liability for the accuracy, content, images, videos, licenses, completeness, legality, or reliability of the information contained in this article. If you have any complaints or copyright issues related to this article, kindly contact the provider above.