(MENAFN- DailyFX)
AUD/USD, AUD/JPY, GBP/AUD Technical Forecast Australian Dollarconsolidation keeps defining its technical progress BothAUD/USDandAUD/JPYare pressuring lows last seen in 2009 Meaningful upside progress has been made inGBP/AUD , will it last?
Build confidence in your own Australian Dollar trading strategywith the help of our free guide!
AUD/USD Technical Outlook - Neutral
The Australian Dollar continues to pressure lows last seen since March 2009 against theUS Dollar . Positive RSI divergence still undermines its downside progress as it shows fading downward momentum. Lately, the pro-risk currency has been torn between theFederal Reserve outlook and US-China trade warsas it is on the brink of resuming this year's dominant downtrend.
The March 2009 low around 0.6744 has been reinforced as support since the beginning of this month with the Aussie trading mostly in a narrow range. This does set AUD/USD up for a meaningful downside breakout that exposes 0.6708. Still, the positive RSI divergence can precede a turn higher towards resistance at 0.6827 – 0.6865 if not translate into consolidation. So far, it has been the latter.
AUD/USD Daily Chart
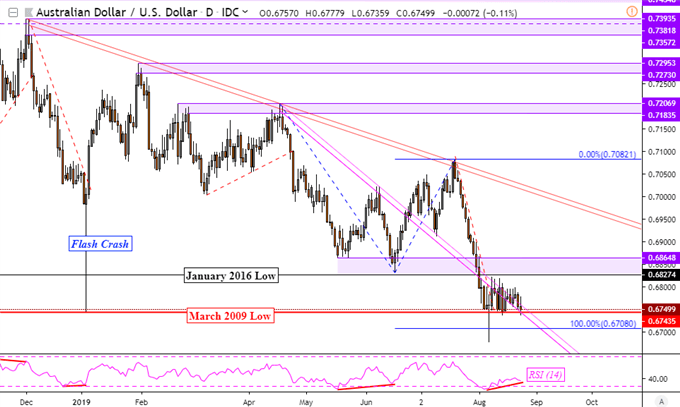
Chart created in TradingView
AUD/JPYTechnical Outlook - Neutral
A near-identical story has been unfolding in AUD/JPY. Against theJapanese Yen , the Australian Dollar has been in persistent consolidation as it pressures lows last seen in 2009. Positive RSI divergence is also present here, potentially paving the way for an upside push towards resistance at 72.89. A breakout to the downside, with technical confirmation, exposes the next area of support at 69.50.
AUD/JPY Daily Chart
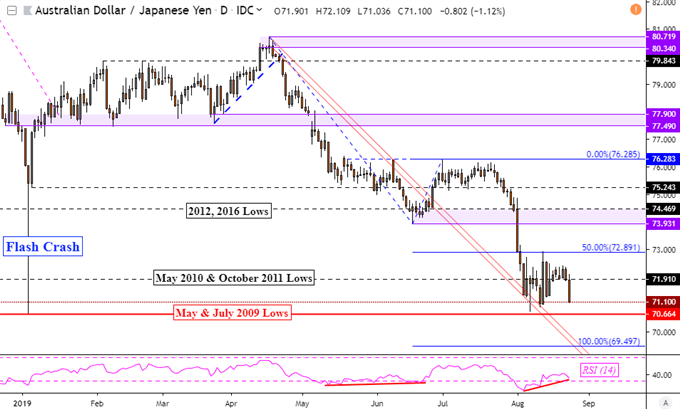
Chart created in TradingView
GBP/AUDTechnical Outlook – Bullish
For meaningful technical progress seen last week from Aussie crosses, look no further than GBP/AUD. TheBritish Poundhas made an upside push against the Australian Dollar after closing above former support-turned-resistance between 1.8100 and 1.8152. This has exposed the next range of resistance between 1.8367 and 1.8423. Another close higher may offer that technical confirmation that paves the way for more gains.
GBP/AUD Daily Chart
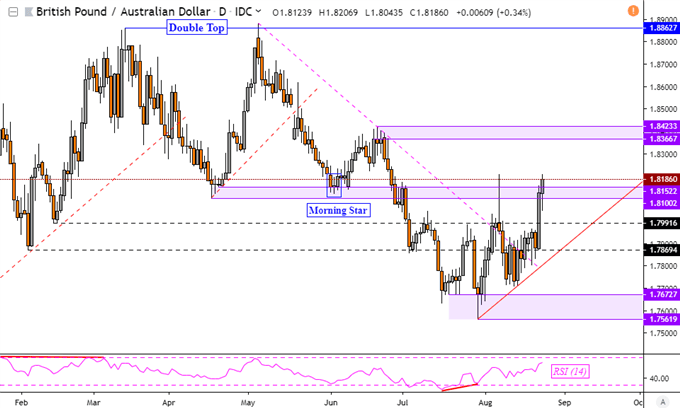
Chart created in TradingView
FX Trading Resources
Having trouble with your strategy?Here's the #1 mistake that traders make See how the Australian Dollar is viewed by the trading community at theDailyFX Sentiment Page Just getting started?See our beginners' guide for FX traders
--- Written by Daniel Dubrovsky, Currency Analyst for DailyFX.com
To contact Daniel, use the comments section below or@ddubrovskyFXon Twitter
MENAFN2408201900760000ID1098920660
Legal Disclaimer:
MENAFN provides the information “as is” without warranty of any kind. We do not accept any responsibility or liability for the accuracy, content, images, videos, licenses, completeness, legality, or reliability of the information contained in this article. If you have any complaints or copyright issues related to this article, kindly contact the provider above.