(MENAFN- FxPro) 
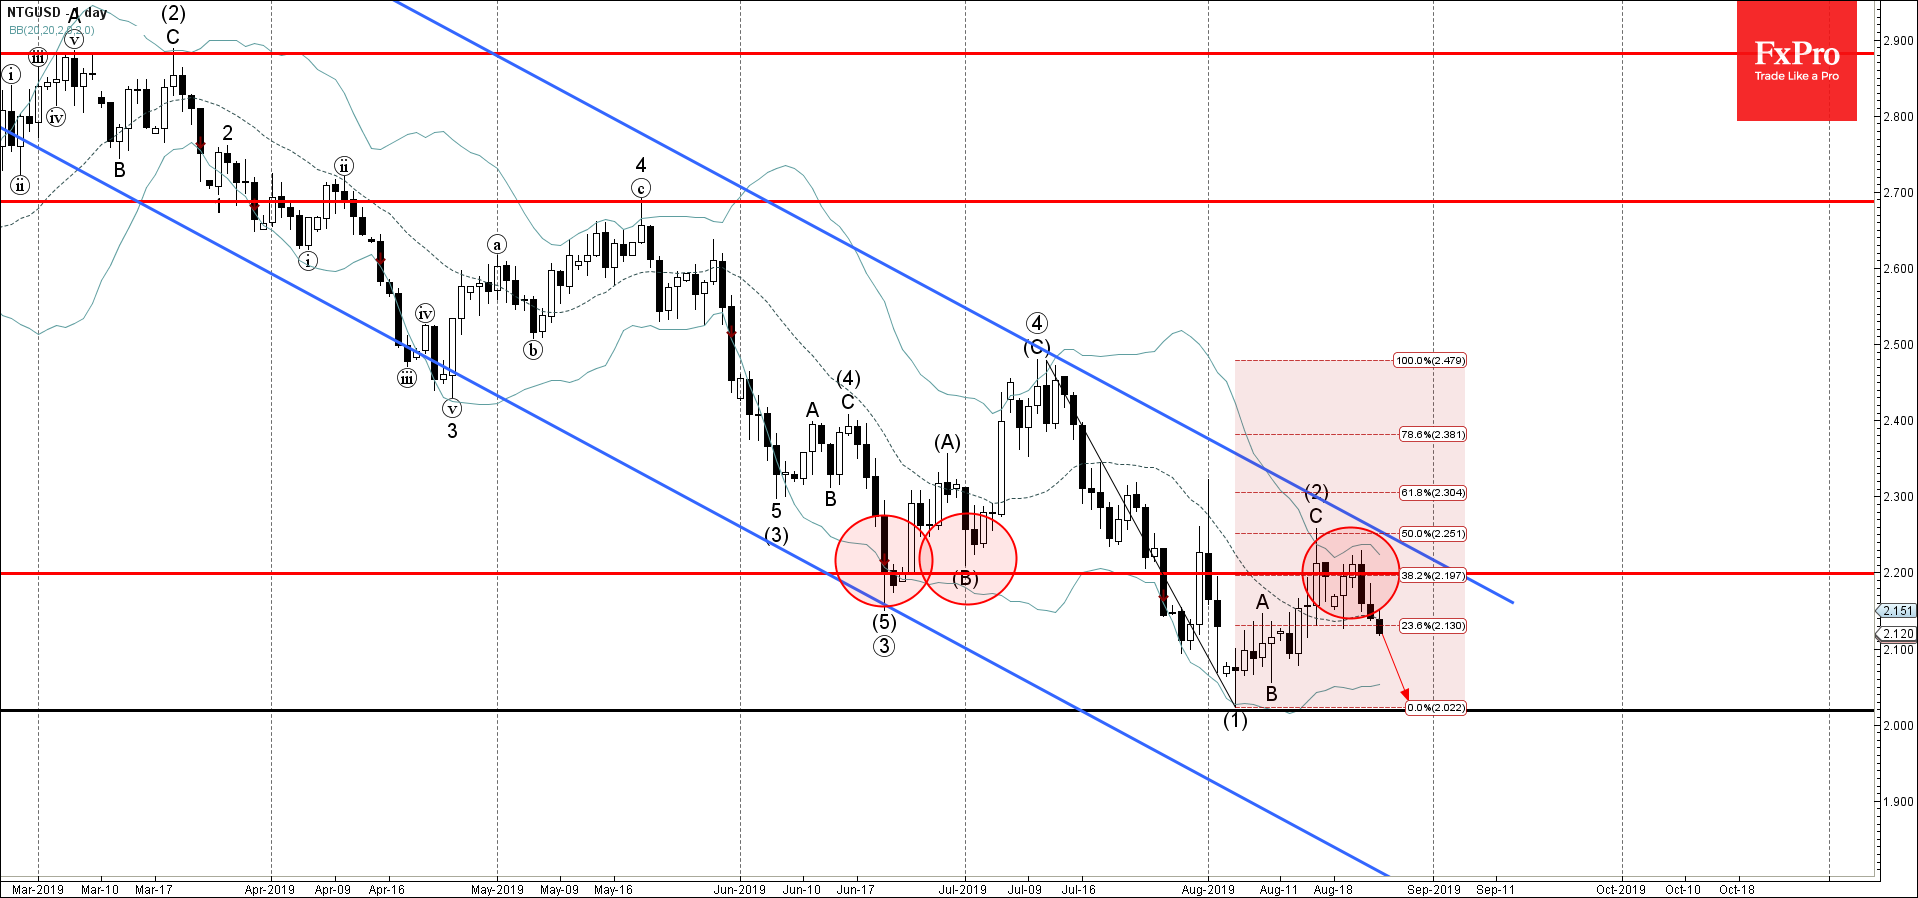
- Natural Gas reversed from resistance area
- Further losses are likely
Natural Gas recently reversed down from the resistance area zone between the pivotal resistance level 2.200 (former strong support from June), upper daily Bollinger Band and the 38.2% Fibonacci correction of the previous downward impulse (1) from July.
This resistance area was further strengthened by the upper resistance trendline of the daily down channel from 2018.
Natural Gas is expected to fall further in the active impulse wave (3) and retest the next support level 2.020 (low of wave (1)).
MENAFN2408201901560000ID1098919988
Legal Disclaimer:
MENAFN provides the information “as is” without warranty of any kind. We do not accept any responsibility or liability for the accuracy, content, images, videos, licenses, completeness, legality, or reliability of the information contained in this article. If you have any complaints or copyright issues related to this article, kindly contact the provider above.