(MENAFN- DailyFX) Dow Jones Forecast:The Dow Jones will search for support in the week ahead after President Trump eviscerated investor confidence on Friday With an uncertain fundamental landscape, technical levels may see increased influence as traders look for entry and exit points amid heightened volatility Interested in equities? Check out theDailyFX Podcast with Andrew Milligan , head of global strategy at Aberdeen Standard Investments
Dow Jones Price Forecast for the Week Ahead
TheS & P 500 , Dow Jones andNasdaq100 were crippled on Friday after aseries of Tweetsfrom President Trump rattled investor confidence following a speech from Federal Reserve Chairman Jerome Powell. In the address, Chairman Powell offered little indication that significant rate cuts were on the table, evidently drawing the ire of the President. In response, President Trump alluded to a serious escalation in the US-China trade war. Consequently, the Dow Jones will look to grasp for technical support as investors flee from an uncertain and ever-changing market.
Dow Jones Price Chart: Daily Time Frame (February 2018 – August 2019) (Chart 1)
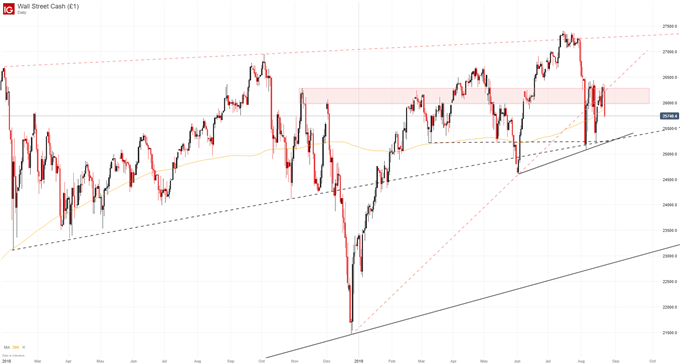
Given the exuberance of Friday's move, we should look to a broader timeframe of the Dow Jones Industrial Average to see where the major levels of interest lie. To that end, recent price action has pushed theDJIAaway from trendline resistance and the rectangular zone of influence marked by November 2018 highs around 26,285.
Therefore, the next area to wield significant technical merit is around 25,250 where two ascending trendlines meet horizontal support from prior lows marked in March, May and August. Thus, if bearishness continues next week this area will look to play a major role in keeping the Dow Jones afloat. Should the level break down, subsequent support becomes more opaque but bulls could look to make a stand around the psychological 25,000 and June lows around 24,590.
Sign up for ourFree Weekly Equity Webinarin which critical technical levels and fundamental themes are analyzed each week.
If fundamental headwinds subside over the weekend, a bullish recovery would look to target the levels near Friday morning price action. These levels include the ascending trendline from December around 26,200 and the band of resistance from prior highs beginning at 26,000. Although, Friday's break beneath the 200-day moving average may also look to refute a quick recovery – currently floating around 25,860. For more technical analysis and fundamental updates on the major equity markets, follow@PeterHanksFXon Twitter.
--Written by Peter Hanks, Junior Analyst for DailyFX.com
Contact and follow Peter on Twitter@PeterHanksFX
Read more:Canadian Dollar Price Forecast: USD/CAD Strength May Fade
MENAFN2308201900760000ID1098917910
Legal Disclaimer:
MENAFN provides the information “as is” without warranty of any kind. We do not accept any responsibility or liability for the accuracy, content, images, videos, licenses, completeness, legality, or reliability of the information contained in this article. If you have any complaints or copyright issues related to this article, kindly contact the provider above.