(MENAFN- DailyFX) Gold Price Talking Points: Gold priceshaven't made a fresh six-year-high in a week after finding resistance just inside of 1535, indicating a bit of digestion ahead of a couple of big drivers on the economic calendar. After a quick spike-lower last week on the back of the additional tariff announcement, prices have stabilized, finding support on a bullish trend-line connecting that swing to the Monday low. The next few days bring a high-risk environment with the Jackson Hole Economic Symposium. If Central Banks talk up loose policy parameters, in the form of lower rates and/or QE, Gold bulls may have an open path to bullish continuation.
Gold prices have calmed after yetanother bullish breakout showed-up in early-August . While this wasn't quite to the same degree as the bullish backdrop that showed during June trade, prices continued to extend-higher with a minimum of pullback or slowing until the start of this week; and with the event risk on the horizon, it makes sense as to why this might be taking place. A little later today at 2PM ET brings the release ofFOMCmeeting minutes from the most recent rate decision. This is when the Fed cut rates for the first time since the Financial Collapse, but while doing so, posed that move as a 'mid cycle' adjustment, alluding to the fact that the bank may not have had more plans for future cuts. The net response from that outlay was a quick spurt of USD-strength, which initially helped to soften Gold prices down to support around the 1410 level.
But, less than 24 hours after that rate cut another driver showed up that had a far different impact on Gold prices when an additional round of tariffs were announced on China. This pushed theUS Dollardown as the wide-expectation was for a more dovish FOMC in response; and collectively, with both lower-rate expectations and greater geopolitical tension helping to drive Gold beyond the 1500-handle.
Today's meeting minutes will highlight the internal discussions at the bank, helping market participants to get a pulse on just how dovish the Fed was a few weeks ago. While this may seem to matter little with our current context, it is key as a large amount of divergence remains between FOMC expectations for future rate policy and that being looked for in futures markets.
At this stage, Gold has been in a state of digestion over the past week and support is holding from a bullish trendline produced by swing lows over that period.
Gold Hourly Price Chart
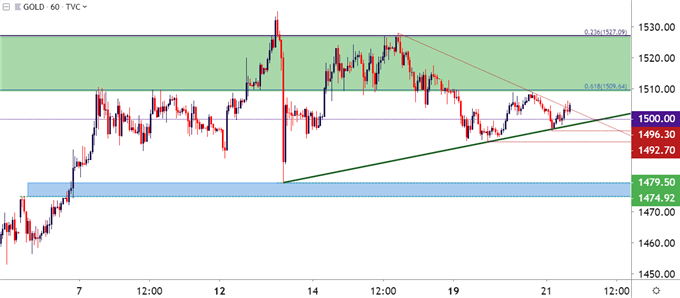
Chart prepared byJames Stanley ;Gold on Tradingview
Taking a step back, that recent digestion takes on the form of a symmetrical wedge pattern as there's been a narrowing range of price action since that fresh six-year-high came into play last Tuesday. Given the prior topside ramp from that early-August bullish breakout, this formation takes on the shape of a bull pennant formation, which will often be approached with the aim of topside continuation.
Gold Price Four-Hour Chart
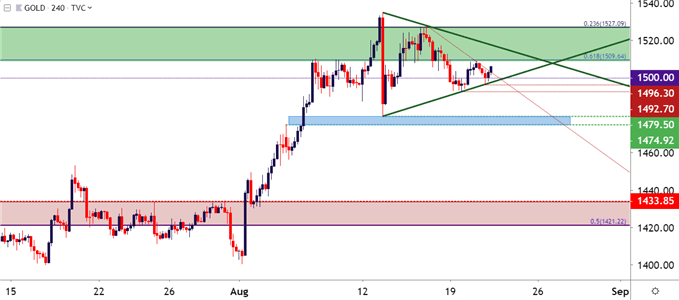
Chart prepared byJames Stanley ;Gold on Tradingview
Gold Price Strategy
Given the current round of digestion combined with the drivers ahead, and there are a couple of different ways that the topside of Gold could be approached at the moment.
For aggressive stances, a hold of support as shown from the bullish trendline looked at above can keep the door open for continuation strategies. This can be coupled with stop placement underneath swing lows around either 1496 or 1492, looking for bullish momentum to carry price action back-above the 1509.64 Fibonacci level.
For those that would like to approach the matter less-aggressively, bullish breakout potential exists at that 1509.64 Fibonacci level, and that could be coupled with initial targets around the swing high at 1517, at which point stops could be adjusted up to break-even while the remainder of the position looks for a re-test of the 1527 Fibonacci level and, perhaps even more.
Gold Price Two-Hour Chart
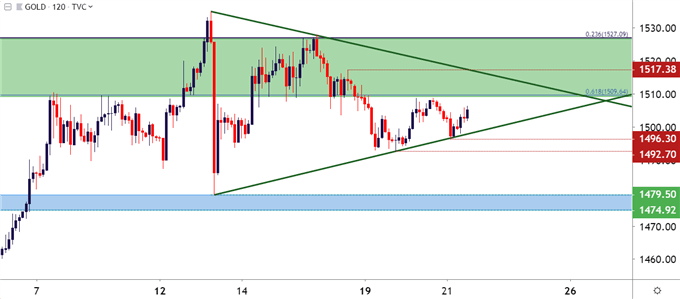
Chart prepared byJames Stanley ;Gold on Tradingview
To read more:
Are you looking for longer-term analysis on the U.S. Dollar? OurDailyFX Forecasts have a section for each major currency, and we also offer a plethora of resources onGoldorUSD -pairs such asEUR/USD ,GBP/USD ,USD/JPY ,AUD/USD . Traders can also stay up with near-term positioning via ourIG Client Sentiment Indicator .
Forex Trading Resources
DailyFX offers an abundance of tools, indicators and resources to help traders. For those looking for trading ideas, ourIG Client Sentimentshows the positioning of retail traders with actual live trades and positions. Ourtrading guidesbring our DailyFX Quarterly Forecasts and our Top Trading Opportunities; and ourreal-time news feedhas intra-day interactions from the DailyFX team. And if you're looking for real-time analysis, ourDailyFX Webinarsoffer numerous sessions each week in which you can see how and why we're looking at what we're looking at.
If you're looking for educational information, ourNew to FX guideis there to help new(er) traders while ourTraits of Successful Traders researchis built to help sharpen the skill set by focusing on risk and trade management.
--- Written by James Stanley, Strategist for DailyFX.com
Contact and follow James on Twitter:@JStanleyFX
MENAFN2108201900760000ID1098909112
Legal Disclaimer:
MENAFN provides the information “as is” without warranty of any kind. We do not accept any responsibility or liability for the accuracy, content, images, videos, licenses, completeness, legality, or reliability of the information contained in this article. If you have any complaints or copyright issues related to this article, kindly contact the provider above.