(MENAFN- DailyFX) US Dollar Talking Points:It's a big week for theUS Dollaralthoughthe economic calendaris back-loaded. After a quiet Monday and Tuesday, the Jackson Hole Economic Symposium kicks off on Wednesday and runs into the end of the week. Stocks are rallying ahead of the US open and this theme will likely remain center-stage ahead of and around Jackson Hole. DailyFX Forecasts are published on a variety of markets such asGold , theUS Dollarorthe Euroand are available from theDailyFX Trading Guides page . If you're looking to improve your trading approach, check outTraits of Successful Traders . And if you're looking for an introductory primer to the Forex market, check out ourNew to FX Guide . US Dollar in Focus Ahead of Jackson Hole
The early portion of this week's economic data outlay is rather light, but it's expected to be a big week for the US Dollar given the drivers showing up on Wednesday. The big item for this week is the Jackson Hole Economic Symposium, with a speech fromFOMCChair Jerome Powell scheduled for Thursday at 10AM ET. Given the heavy focus given to FOMC policy of late, this speech, along with accompanying speeches from various Fed members at the three-day event from Wednesday-Friday, will likely receive considerable attention as markets attempt to identify just how dovish the Fed might be.
At this point,the US Dollar has recovered a large-portion of the sell-offthat showed on the back of the post-Fed tariff announcement. Resistance last week showed up around the 98.33 level that previously helped to define the yearly high in the currency in May of this year. And of this week, resistance so far has held below that level, around the 23.6% Fibonacci retracement of the June-July bullish move at 98.20.
US Dollar Four-Hour Price Chart
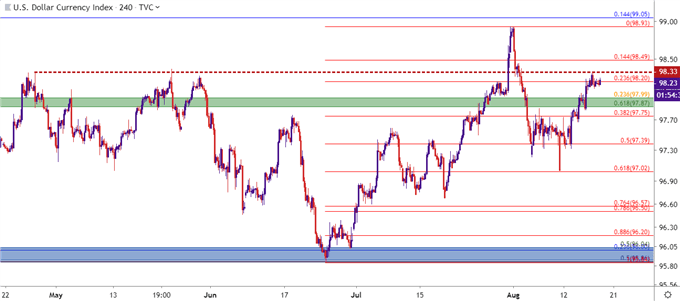
Chart prepared byJames Stanley ;US Dollar on Tradingview
EUR/USD Pulls Back From Fresh Two-Week-Lows
One of the bigger surprises from last week wasOlli Rehn's comments regarding stimulus from the ECB . Rehn pointed out the continued weakening in the European economy, illustrated by the GDP contraction from Germany in Q2, as evidence that the bank needed to come to the table with something 'significant' at their September rate decision.
Ironically,this isn't the first ECB denotation towards softer policy . Last month's ECB rate decision carried the prospect for a cut. That didn't happen, and despite a familiar dovishness from ECB President Mario Draghi, the single currency ripped-higher as the bank appeared reticent to commit to a rate cut just yet. But, just hours after the conclusion of the accompanying press conference, ECB 'sources' mentioned that the bank was ready to cut by 10 basis points in September. This helped to slow the up-trend but given dynamics in the US Dollar, the potential still remained for a strongerEuro , particularly if the FOMC took on an even more dovish posture.
Last week's hat tip towards stimulus, however, came as a bit of surprise, and this helped the Euro to sell-off to fresh two week lows. If the US Dollar does remain strong, particularly around the Jackson Hole Economic Symposium, the short-side ofEUR/USDcan remain as attractive, with targets set towards the psychological 1.1000 level which might finally come into play after months of posturing around 1.1100.
EUR/USD Four-Hour Price Chart
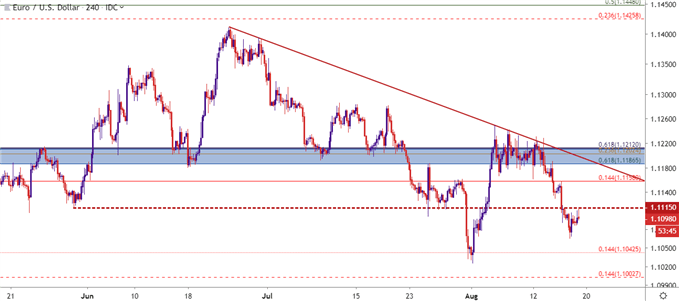
Chart prepared byJames Stanley ;EURUSD on Tradingview
GBP/USD: Cable Collection
GBP/USD ran into a long-term trend-line a couple of weeks ago , taken from significant swing lows set in 1985 and 2016.
GBP/USD Monthly Price Chart
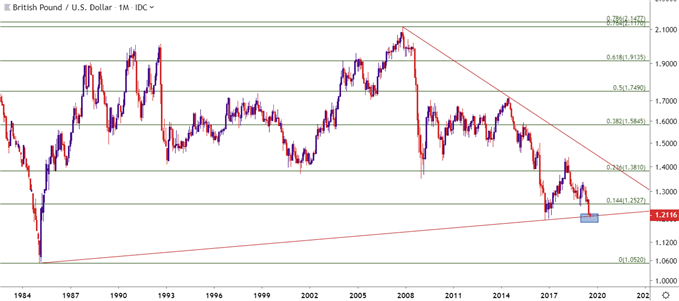
Chart prepared byJames Stanley ;GBPUSD on Tradingview
This didn't stop the declines, however, as sellers made an aggressive push towards a 1.2000 level that never came into play. Since then and over the past week, price action in the pair has trended-higher, taking on the shape of a bear flag formation. This puts focus on a resistance zone that rests a bit-higher on the chart, taken from the area around 1.2191-1.2211, which currently helps to define the August highs in the pair.
GBP/USD Two-Hour Price Chart
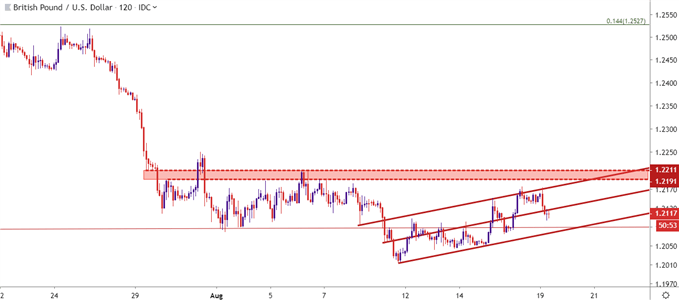
Chart prepared byJames Stanley ;GBPUSD on Tradingview
AUD/USD: Support Build from .6750
I had looked at this one in this week's Technical Forecast,asking the question as to whether the Aussie has finally found some element of support . It's been a brutal year, to be sure, and this extends a bearish run that started in January of 2018 when the pair topped-out over the .8100 level on the chart.
The price of .6750 is of interest at the moment as this was the level that helped to set the low during the flash crash that showed to open the year.
AUD/USD Monthly Price Chart
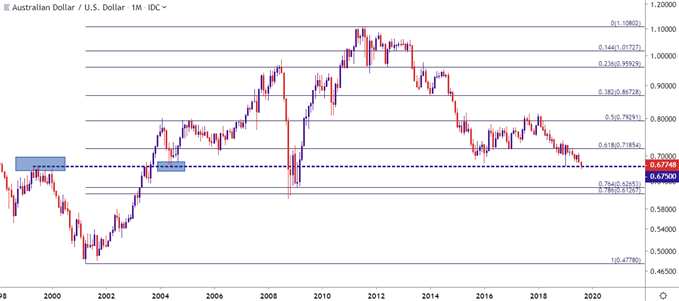
Chart prepared byJames Stanley ;AUDUSD on Tradingview
This price came back into play a couple of weeks ago and sellers even made an aggressive push below; but that was quickly offset asprice actionreturned right back to .6750. Since then, there's been a continued build of support here, leading to the question as to whetherAUD/USDhas finally found support.
AUD/USD Daily Price Chart
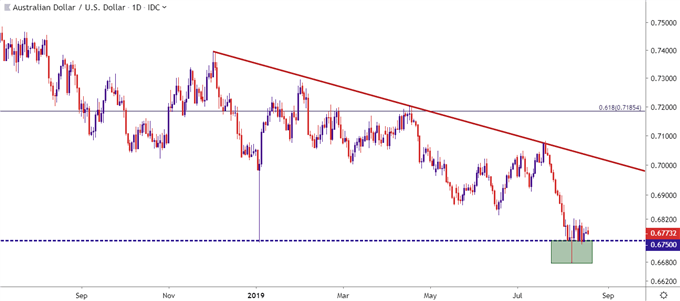
Chart prepared byJames Stanley ;AUDUSD on Tradingview
USD/CAD: Has the Bullish Theme Topped-Out?
It's been a busy couple of months in USD/CAD: The pair was in an aggressive bearish trend in June and early-July, eventually finding some support just above the 1.3000 handle. As sellers postured around this price, a falling wedge formation built and this will often lead into bullish reversals. That bullish theme began to play out around the FOMC rate decision and largely continued into last week. This has led to the build of a bullish trend channel on the chart.
Of interest –last week brought a lower-high in USD/CAD as bulls were unable to test above the prior week's swing-high . This keeps the door open for bearish strategies, particularly should the bullish channel begin to give way.
USD/CAD Eight-Hour Price Chart
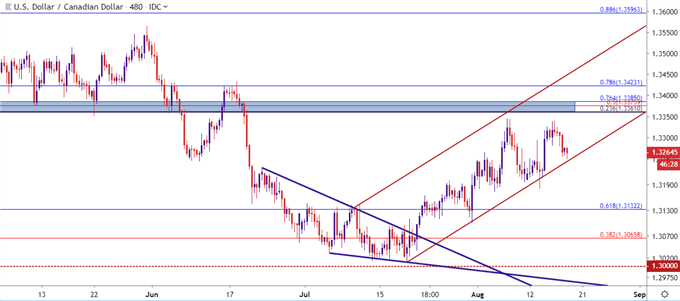
Chart prepared byJames Stanley ;USDCAD on Tradingview
To read more:
Are you looking for longer-term analysis on the U.S. Dollar? OurDailyFX Forecasts have a section for each major currency, and we also offer a plethora of resources onGoldorUSD -pairs such asEUR/USD ,GBP/USD ,USD/JPY ,AUD/USD . Traders can also stay up with near-term positioning via ourIG Client Sentiment Indicator .
Forex Trading Resources
DailyFX offers an abundance of tools, indicators and resources to help traders. For those looking for trading ideas, ourIG Client Sentimentshows the positioning of retail traders with actual live trades and positions. Ourtrading guidesbring our DailyFX Quarterly Forecasts and our Top Trading Opportunities; and ourreal-time news feedhas intra-day interactions from the DailyFX team. And if you're looking for real-time analysis, ourDailyFX Webinarsoffer numerous sessions each week in which you can see how and why we're looking at what we're looking at.
If you're looking for educational information, ourNew to FX guideis there to help new(er) traders while ourTraits of Successful Traders researchis built to help sharpen the skill set by focusing on risk and trade management.
--- Written by James Stanley, Strategist for DailyFX.com
Contact and follow James on Twitter:@JStanleyFX
DailyFX
MENAFN1908201900760000ID1098899720
Legal Disclaimer:
MENAFN provides the information “as is” without warranty of any kind. We do not accept any responsibility or liability for the accuracy, content, images, videos, licenses, completeness, legality, or reliability of the information contained in this article. If you have any complaints or copyright issues related to this article, kindly contact the provider above.