(MENAFN- DailyFX)
Gold (XAU) Price, Silver (XAG) Price Analysis and Chart
Global risk sentiment remains, interest rates look set to go lower.FOMCminutes on Wednesday, Fed chair Powell speaks at Jackson Hole on Friday
Q3 2019 Gold Forecast and Top Trading Opportunities
Gold Remains Underpinned and Ready to Move Higher
Gold remains bid and underpinned around current levels and is looking for the next bullish impulse to send it through its recent multi-year high. Risk sentiment, one of gold's main drivers, remains with US-China trade talks still not confirmed, while in Hong Kong, mass protests continue, and these may well be a hot topic of discussion between the US and China. On Wednesday the latest FOMC minutes, while on Friday, Federal Reserve Chairman Jerome Powell will speak at the Jackson Hole Symposium and he may well give further insights into the central bank's thinking around the next round of US interest rate cuts. Any hint of that the Fed wants to get ahead of the curve and cut rates aggressively will push gold higher.
The daily gold chart suggest further short-term consolidation as the market unwinds its recent heavily overbought bias. There are a few recent lows between $1,487/oz. and $1,503/oz. that will support gold in the case of any sell-off, while to the upside, $1,520/oz. before $1,528/oz. and $1.535/oz. If this latter level is broken and closed above, then $1,540/oz. is the next upside target.
Gold Price Daily Chart (January - August 19, 2019)
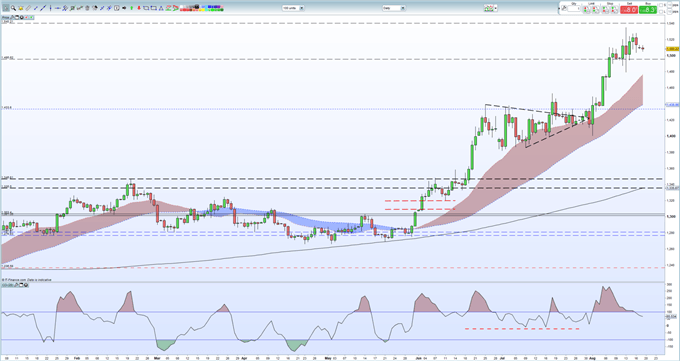
IG Client Sentimentdata show that 62.3% of retail traders are net-long of gold, a bearish contrarian indicator. However, recent daily and weekly positional changes give us a stronger bearish contrarian trading bias.
How to Trade Gold: Top Gold Trading Strategies and Tips
Silver Price Struggling Around Multi-Month Highs
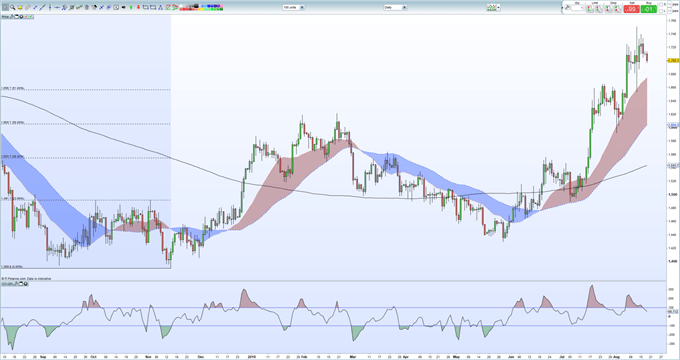
Silveris stuck in a short-term downtrend after hitting $17,51/oz. last week when the commodity space rallied. Since then, silver has made a series of lower high and lower lows and if price breaks below $17,00/oz. then the August 8 and 12 double low at $16.80/oz. will be tested. Below here, the 61.8% Fibonacci retracement at $16, 57/oz. should provide strong support. Silver has moved out of overbought territory and will likely remain in lock-step with theprice of gold .
The gold/silver ratio remains stable around 88.60.
Silver Daily Price Chart (August 2018 – August 19, 2019)
How to Trade Silver: Top Trading Strategies
Traders may be interested in two of our trading guides –Traits of Successful TradersandTop Trading Lessons– while technical analysts are likely to be interested in our latestElliott Wave Guide .
What is your view on Gold and Silver – bullish or bearish?? You can let us know via the form at the end of this piece or you can contact the author or via Twitter@nickcawley1 .
MENAFN1908201900760000ID1098898111
Legal Disclaimer:
MENAFN provides the information “as is” without warranty of any kind. We do not accept any responsibility or liability for the accuracy, content, images, videos, licenses, completeness, legality, or reliability of the information contained in this article. If you have any complaints or copyright issues related to this article, kindly contact the provider above.