(MENAFN- DailyFX) 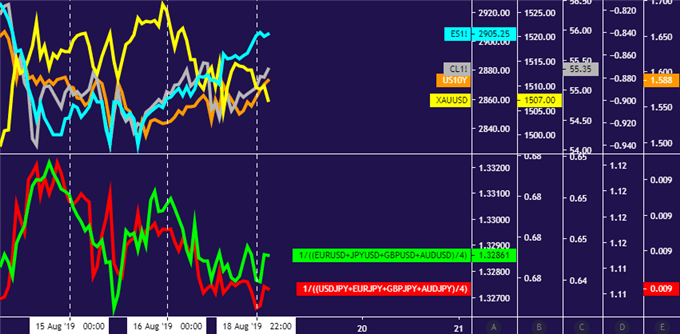
Crude oil,gold priceperformance chart created usingTradingView
GOLD & CRUDE OIL TALKING POINTS:Gold price technical positioning hints at pullback brewing ahead Crude oil pricesidling near $55/bbl as risk trends await catalyst FOMCand ECB meeting minutes, Jackson Hole in the spotlight
A risk-on mood broadlyprevailed across global financial markets Friday . Cycle-sensitive crude oil prices edged higher alongside stocks. Treasury bond yields also rose as capital moved away from haven assets, undermining the appeal of non-interest-bearing alternatives and weighing on gold. The anti-riskUS DollarandJapanese Yenlikewise declined.
From here, a slow start to an otherwise action-packed week might see key assets idling as traders withhold conviction before forthcoming event risk. Minutes from July's FOMC and ECB meetings as well as the Fed's Economic Policy Symposium due to kick off Thursday in Jackson Hole, Wyoming will probably take top billing.Political turmoil in Italyalso warrants attention.
With slowing global growth top-of-mind for investors, scope for incoming monetary stimulus expansion is a critical consideration. The ECB is widely expected to ease next month, but its preferred delivery strategy is unclear. As for the Fed, the markets are priced for 75bps in additional rate cuts before year-end. Such robust hopes may be disappointed by a more reserved central bank, souring risk appetite anew.
Get our free guide to helpbuild confidence in your gold and crude oil trading strategy !
GOLD TECHNICAL ANALYSIS
Gold prices are treading water below the monthly swing high at 1535.03. Negative RSI divergence warns of ebbing upside momentum, hinting that a pullback might be in the cards. A break below initial support at 1480.00 exposes the 1437.70-52.95 zone. Alternatively, a push above resistance aims for a weekly chart inflection level at 1563.00.
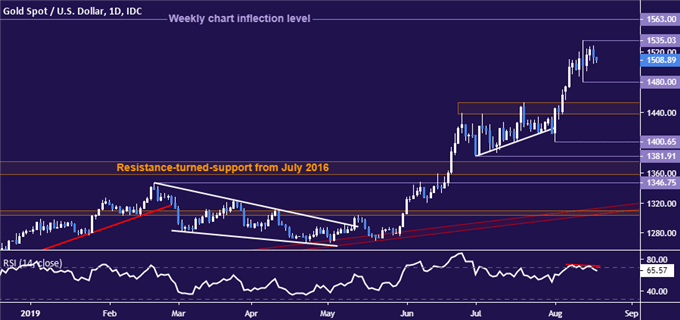
Gold price chart created usingTradingView
CRUDE OIL TECHNICAL ANALYSIS
Crude oil prices continue to mark time near the 54.72-56.09 congestion area. Resistance defining the near-term bearish bias is now at 58.48, with a daily close above that targeting the 60.04-84 zone next. Critical support is clustered around the $50/bbl figure. Breaking below that sets the stage for a descent to challenge three-year lows just above the $42/bbl mark.
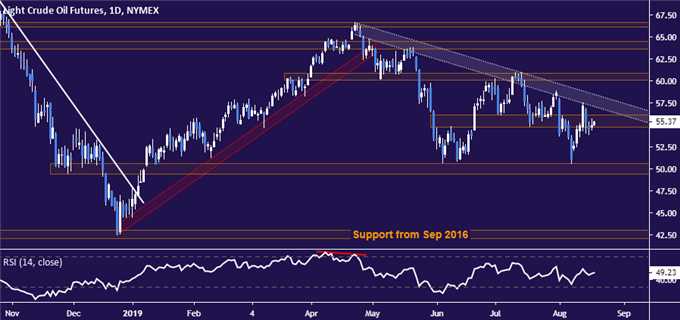
Crude oil price chart created usingTradingView
COMMODITY TRADING RESOURCESSee our guide to learn about thelong-term forces driving crude oil prices Having trouble with your strategy? Here's the#1 mistake that traders makeJoin a free webinarand have your commodity market questions answered
--- Written by Ilya Spivak, Currency Strategist for DailyFX.com
To contact Ilya, use the comments section below or@IlyaSpivakon Twitter
DailyFX
MENAFN1908201900760000ID1098897732
Legal Disclaimer:
MENAFN provides the information “as is” without warranty of any kind. We do not accept any responsibility or liability for the accuracy, content, images, videos, licenses, completeness, legality, or reliability of the information contained in this article. If you have any complaints or copyright issues related to this article, kindly contact the provider above.