(MENAFN- DailyFX) Nasdaq 100 Outlook:Disappointing earnings from Netflix sent the stock diving 12% lower to shatter the implied price range The underwhelming performance damages tech sentiment and will likely pressure theNasdaq100 in Thursday trading Interested in earnings season?Learn about the key facts and why it is important to the stock market
Nasdaq 100 Outlook: NFLX Stock Dives on Earnings, MSFT Up Next
The Nasdaq 100 closed Wednesday trading -0.48% lowerafter mixed results from a few large corporationslike Bank of America and United Airlines weighed on earnings season sentiment. On top of the varied reports, President Trump warned tariff hikes are on the table – rattling investor confidence. Heading into Thursday's session, the Nasdaq 100 is likely due for a continuation lower after disappointing earnings from Netflix.
Netflix (NFLX) Stock Price Chart: Daily Time Frame (January – July) (Chart 1)
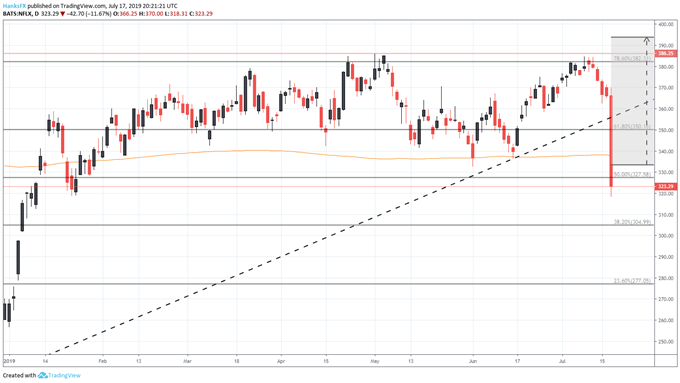
The streaming-giant split expectations from a top and bottom-line perspective, beating on earnings while slightly missing on revenue but the real damage was dealt when the company failed to add its forecasted number of new subscribers for the quarter.
Despite a projected addition of 5 million paid accounts, Netflix delivered only 2.7 million in Q2 as domestic accounts declined by 126k. The lack of growth is particularly concerning ahead of a flurry of new entrants – like Disney – to the industry. That fact was not lost on investors and NFLX shares reacted accordingly, trading 12% lower in the after-hours session andshattering the earnings implied price range alongside the 200-day moving average.
Earnings to Watch
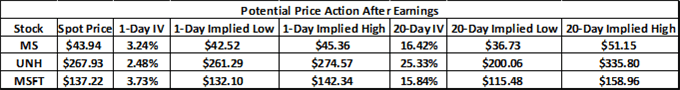
Morgan Stanley (MS)
That said, there are some reports due that could stem the expected bleed in Thursday trade. First up, Morgan Stanley (MS) is scheduled to report before the open. As one of the final large banks to report, common themes have had the opportunity to emerge across the industry which could explain the rather subdued implied volatility for the stock. At just 3.2%, the implied price range encompasses the 200-day moving average beneath and recent topside resistance around $44.80.
Morgan Stanley (MS) Stock Price Chart: Daily Time Frame (January – July) (Chart 2)
UnitedHealth Group (UNH)
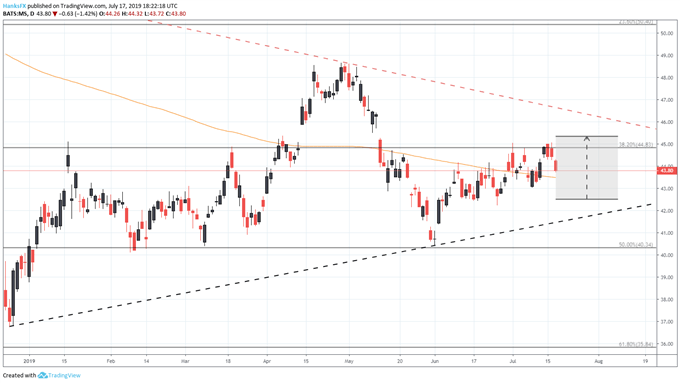
Next is theDow Jonesheavy-weight UnitedHealth Group (UNH). AsBoeing (BA) flounders amid 737 Max issues,UNH is gaining ground on the plane-maker's control over the Industrial Average and is now responsible for 6.6% of the Index. As a component of the healthcare sector, one-day implied volatility is muted at 2.5%. That said, an encouraging report could propel UNH to probe recent highs around $271.
UnitedHealth Group (UNH) Stock Price Chart: Daily Time Frame (January – July) (Chart 3)
Microsoft (MSFT)
Finally, Microsoft has enjoyed a relatively unabated climb in recent months, boasting a 36% return in the year-to-date. As the largest publicly traded company in the world by market capitalization, MSFT is afforded considerable influence over the Nasdaq 100, Dow Jones andS & P 500 . It accounts for 11.1%, 3.4% and 4.2% of each index respectively. By comparison, NFLX accounts for just 1.8% of the Nasdaq – the index on which it carries the most weight.
Earnings season has arrived! Check out ourThird Quarter Equity Forecastto read about the outlook for the S & P 500 as the season unfolds.
While Microsoft may not be aFAANG member , it effectively plays the same role but would muddy an otherwise catchy acronym. With that in mind, price action for the tech giant should be watched closely as it can sway the entire Nasdaq 100 and has the potential to right the ship after Netflix's miss.
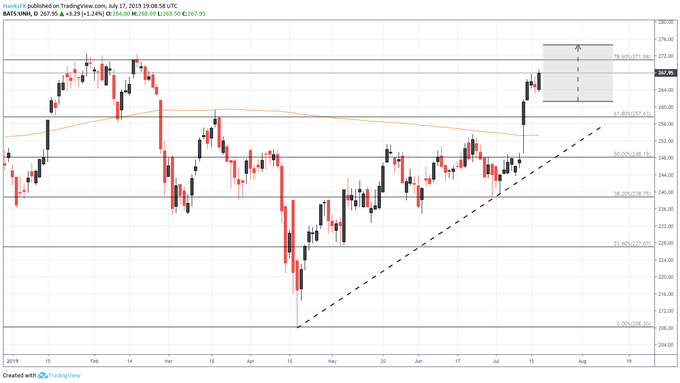
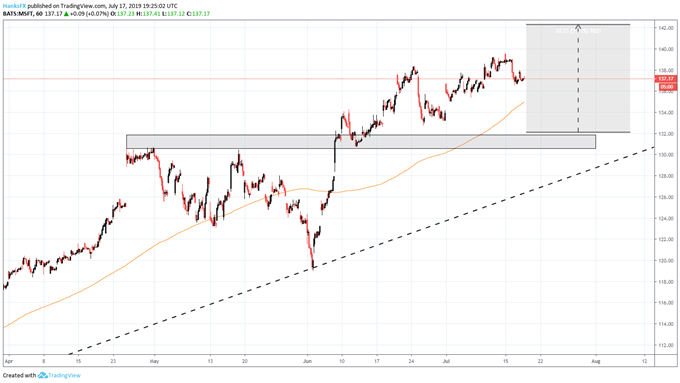
Despite its membership in the tech sector, earnings-implied volatility for Microsoft following earnings is comparably low at just 3.7%. Consequently, the implied price range is $132 to $142, with a recent record high residing at $139.6. Possible support rests just outside the implied price range around $132.
Microsoft (MSFT) Stock Price Chart: Hourly Time Frame (April – July) (Chart 4)
As the market awaits Microsoft, it would be reasonable to assume Netflix will weigh on the Nasdaq in the interim. That weight could drive the Index to test nearby support around 7,855 – the confluence of prior all-time highs and an ascending trendline from mid-June. Should this level fail, subsequent support is lacking until the 7,750 area. In the meantime, follow@PeterHanksFX on Twitter for updates and analysis on key themes and price action as earnings season unfolds.
--Written by Peter Hanks, Junior Analyst for DailyFX.com
Contact and follow Peter on Twitter@PeterHanksFX
Read more:Dow Jones, Nasdaq 100, S & P 500, DAX 30 Fundamental Forecast
DailyFX
MENAFN1707201900760000ID1098771677
Legal Disclaimer:
MENAFN provides the information “as is” without warranty of any kind. We do not accept any responsibility or liability for the accuracy, content, images, videos, licenses, completeness, legality, or reliability of the information contained in this article. If you have any complaints or copyright issues related to this article, kindly contact the provider above.