(MENAFN- DailyFX)
CRUDE OIL & GOLD TALKING POINTS: Crude oil priceslower as tropical storm Barry weakens, IEA warns of glut Incoming EIA drilling productivity data might add to oversupply concernsGold priceslook to Citigroup Q2 earnings report for risk sentiment cues
Crude oil prices drifted lower as tropical storm Barry weakened to a 'depression', triggering reports that long-lasting disruptions in US energy infrastructure will be avoided. Pressure was probably compounded by an IEA report warning that surplus in the oil market has unexpectedly returned despite OPEC-driven production cuts. Supply was said to outstrip demand by 900k barrels per day in the first half of 2019.
Gold prices edged up, erasing most of the prior session's downswing but holding firmly within the choppy price band prevailing since the beginning of the month (see chart below). The move tracked inversely of similarly-looking pullbacks in bond yields and theUS Dollar . Taken together, this price action probably reflects the markets' digestion oflast Wednesday's Fed policy guidance update .
CRUDE OIL AT RISK IF EIA DRILLING DATA STOKES OVERSUPPLY FEARS
Oil traders now turn to the monthly EIA Drilling Productivity report for further evidence of oversupply (recentlylarge outflows from inventoriesnotwithstanding), which might nudge prices lower. Official weekly data puts output at 12.3 million barrels per day, within a hair of the record high. Implied global demand readings have idled in a steady range for over a year (though they've risen within it recently).
Gold prices are edging lower in Asia Pacific trade asupbeat Chinese economic datastokes risk appetite and drives yields higher.S & P 500futures are trading close to flat however, warning that the risk-on push may not have scope for follow-through. Traders may be treading cautiously ahead of the second-quarter earnings report from Citigroup, which may opine ominously on the impact of the ongoing global slowdown.
Get the latestcrude oil and gold forecaststo see what will drive prices in the third quarter!
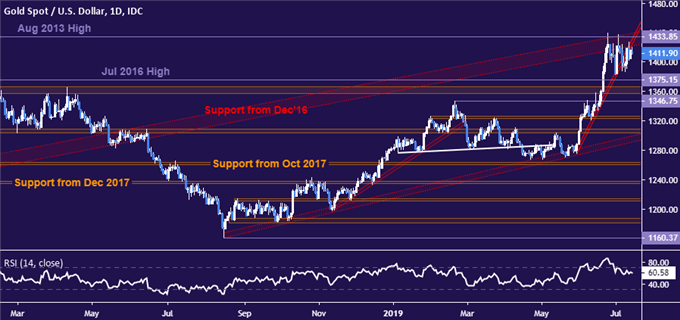
GOLD TECHNICAL ANALYSIS
Gold prices are coiling up in a narrowing congestion range below resistance clustered around the August 2013 high at 1433.85. A break upward sets the stage for a test above the $1500/oz figure. Alternatively, any foray downward faces a formidable support block running down from 1375.15 through 1346.75.
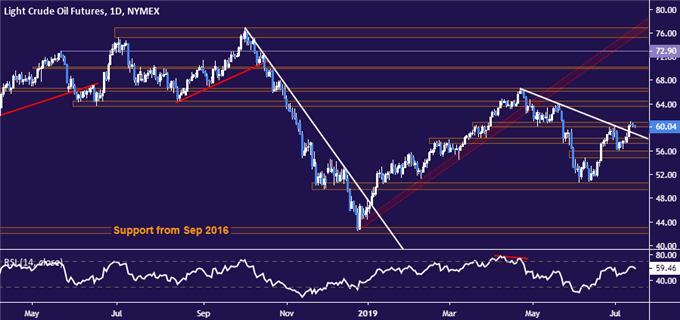
CRUDE OIL TECHNICAL ANALYSIS
Crude oil prices are struggling to make good on a break of trend resistance set from late April, idling at resistance in the 60.04-84 area. A break higher from here initially targets the 63.59-64.43 congestion zone. A series of back-to-back support levels extending down through 54.84 caps the downside for now.
COMMODITY TRADING RESOURCESSee our guide to learn about thelong-term forces driving crude oil prices Having trouble with your strategy? Here's the#1 mistake that traders make Join a free webinarand have your commodity market questions answered
--- Written by Ilya Spivak, Currency Strategist for DailyFX.com
To contact Ilya, use the comments section below or@IlyaSpivakon Twitter
MENAFN1507201900760000ID1098758868
Legal Disclaimer:
MENAFN provides the information “as is” without warranty of any kind. We do not accept any responsibility or liability for the accuracy, content, images, videos, licenses, completeness, legality, or reliability of the information contained in this article. If you have any complaints or copyright issues related to this article, kindly contact the provider above.