(MENAFN- DailyFX) EUR/CHF ,USD/CHFPrice Outlook, Charts and Analysis
Eyes on ECB minutes andUS DollarCPI numbers due to release today. USD/CHF and EUR/CHF price action.
Did you check our latest forecasts onUSDandEURandGold? Find out more for free from ourQ3 forecasts for commodities and main currencies
EUR/CHF and USD/CHF Struggle to start an uptrend
At the start of July USD/CHF opened with an upside gap then rallied after and closed the weekly candlestick with 1.5% profit. However; the price dropped this week, leaning to move in a sideways pattern.
In turn, EUR/CHF opened also with an upside gap, however; the pairstruggled to push higherand closed with a Doji pattern for the second week in a raw, reflecting more hesitation form the buyers in pushing the price higher.
Alongside, the Relative Strength Index (RSI) continued flirting with the 50 vicinity in both pairs, but without showing any serious impulse to start up an upwards move.
Just getting started?See our Beginners' Guide for FX traders
USD/CHF Daily Price Chart (OCT 27, 2016 – JULY 11, 2019) Zoomed Out

USD/CHF Daily Price Chart (April 3 – JULY 11, 2019) Zoomed IN
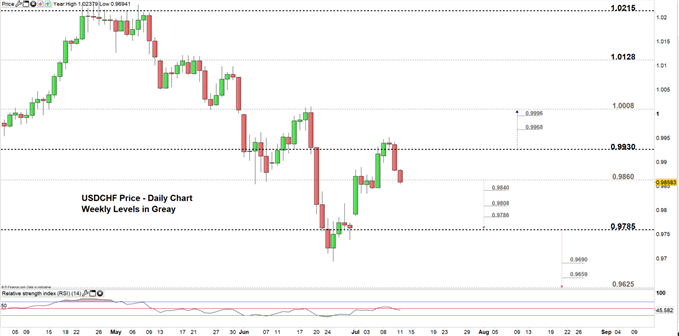
Looking at USD/CHF daily chart, we notice the pair on Tuesday peaked at 0.9951, then dropped today to test a lower trading zone 0.9785 – 0.9860.
Hence, a close below the high end of the aforementioned trading zone may send the price towards the low end, nonetheless; the weekly support levels underlined on the chart (Zoomed in) should be watched along the way.
On the other hand, a failure to close below the high end could cause USD/CHF to rally towards 0.9930, however; the daily resistance vicinity from 0.9885 up to 0.9904 needs to be considered.
Having trouble with your trading strategy?Here's the #1 Mistake That Traders Make
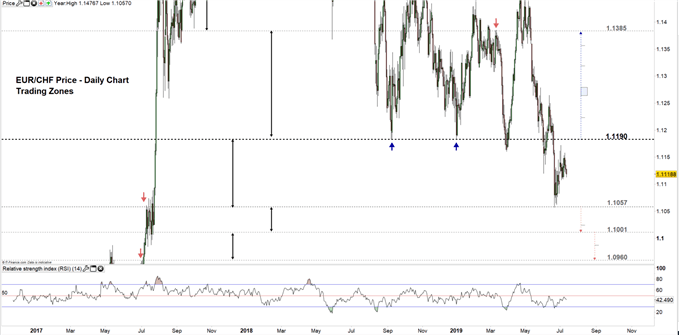
EUR/CHF Daily Price Chart (JAN 26, 2017 – JULY 11, 2019) Zoomed Out
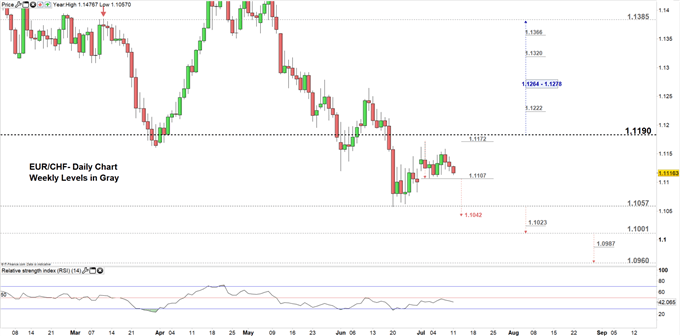
EUR/CHF Daily Price Chart (MAR 6 – JULY 11, 2019) Zoomed IN
Looking at EUR/CHF daily chart, we notice the pair has been pressing towards the high end of the current trading zone 1.1057 – 1.1190, then paused its upward move on July 2 and corrected lower creating a lower high on Tuesday at 1.1158.
Today, the pair is eyeing for a test of the neckline of the double top pattern residing at 1.1107, hence; if the price breaks and remains below the neck line, this suggests EUR/CHF may press towards 1.1042, although; the lower end of the aforementioned trading zone should be kept in focus. See the chart (Zoomed in) to know more about the key levels to consider if the price closes below the low end of the trading zone.
On the flip-side, a rebound from the neck line may cause EUR/CHF to rally towards 1.1190, although; the weekly resistance level marked on the chart needs to be monitored.
Written By:Mahmoud Alkudsi
Please feel free to contact me on Twitter: @Malkudsi
MENAFN1107201900760000ID1098747973
Legal Disclaimer:
MENAFN provides the information “as is” without warranty of any kind. We do not accept any responsibility or liability for the accuracy, content, images, videos, licenses, completeness, legality, or reliability of the information contained in this article. If you have any complaints or copyright issues related to this article, kindly contact the provider above.