(MENAFN- DailyFX) Oil Price Talking Points
Crude looks poised for a larger rebound ahead of the Group of 20 (G20) summit as theprice of oilextends the series of higher highs and lows from the previous week.
Oil Prices Risk Larger Recovery as OPEC+ Leaders Meet at G20 Summit
Developments coming out of the G20 summit may shake up the near-term outlook for crude as US President Donald Trump is scheduled to meet with China President Xi Jinping.
Details of a US-China trade deal should keep oil prices afloat as it boosts the outlook for consumption, but the resolution may do little to deter the Organization of the Petroleum Exporting Countries (OPEC) and its allies from regulating the energy market as the group warns of waning demand.
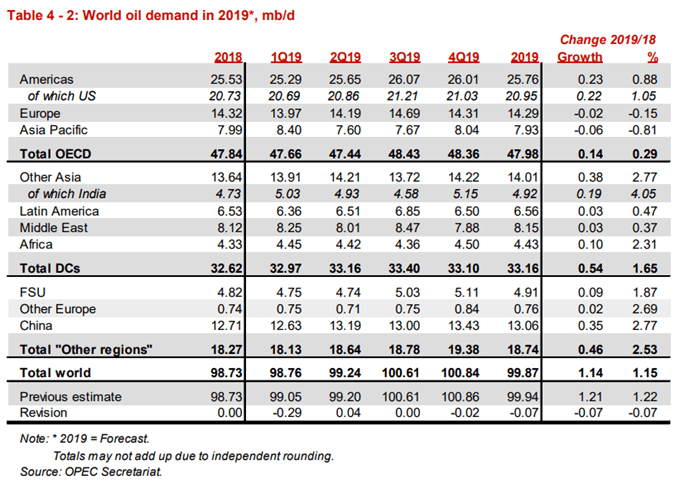
OPEC's most recent Monthly Oil Market Report (MOMR) highlights slower consumption for 2019, with the group noting that 'world oil demand is anticipated to rise by 1.14 mb/d, lower than last month's assessment by 0.07 mb/d.'
In turn, comments from Russian President Vladimir Putin and Saudi Arabia Crown Prince Mohammad bin Salman may have a greater impact on crude prices as the two leaders are slated to meet at the G20 summit, and the group may continue to curb production in 2019 in an effort to stave off a bear market.
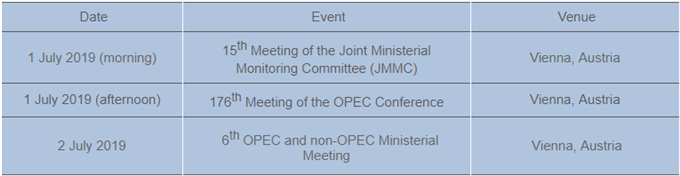
With that said, crude oil prices stand at risk of staging a larger recovery ahead of the OPEC meeting starting on July 1, but the broader outlookis no longer constructive as both price and the Relative Strength Index (RSI) snap the bullish trends from earlier this year.
Crude Oil Daily Chart
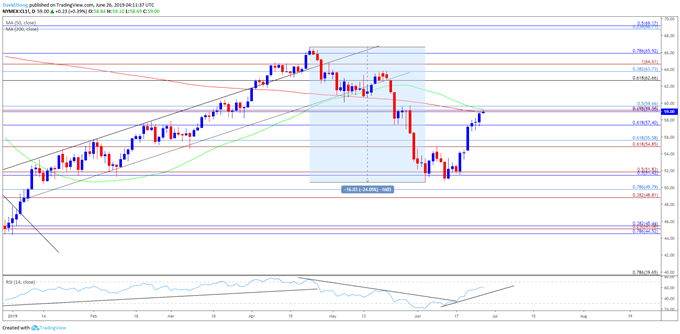
Keep in mind, a 'death cross' formation may emerge over the coming days as the 50-Day SMA ($59.22) approaches the 200-Day SMA ($58.90), with both moving averages tracking a negative slope. However, recent price action raises the risk for a larger rebound as crude breaks out of a narrow range and carves a series of higher highs & lows after failing to test the monthly-low ($50.60). The RSI highlights a similar dynamic as the oscillator bounces back from oversold territory and snaps the bearish formation carried over from late-April. Need a break/close above Fibonacci overlap around $59.00 (61.8% retracement) to $59.70 (50% retracement) to bring the $62.70 (61.8% retracement) region on the radar, with the next area of interest coming in around $63.70 (38.2% retracement) followed by $64.60 (100% expansion).
Sign up and join DailyFX Currency Strategist David Song LIVEfor an opportunity to discuss key themes and potential trade setups.
For more in-depth analysis, check out the2Q 2019 Forecast for Oil
Additional Trading Resources
Are you looking to improve your trading approach? Review the ' Traits of a Successful Trader ' series on how to effectively use leverage along with other best practices that any trader can follow.
Want to know what other markets the DailyFX team is watching? Download and review theTop Trading Opportunitiesfor 2019.
--- Written by David Song, Currency Strategist
Follow me on Twitter at @DavidJSong.
MENAFN2606201900760000ID1098685640
Legal Disclaimer:
MENAFN provides the information “as is” without warranty of any kind. We do not accept any responsibility or liability for the accuracy, content, images, videos, licenses, completeness, legality, or reliability of the information contained in this article. If you have any complaints or copyright issues related to this article, kindly contact the provider above.