(MENAFN- DailyFX)
GOLD & CRUDE OIL TALKING POINTS: Gold priceshover at chart resistance following Fed-inspired rallyCrude oil pricesat 1-month high on stimulus hopes, Iran tensions Commodities may struggle for follow-through before G20 summit
Gold prices are working on a fifth consecutive day of gains against the backdrop of adovish shift in Fed policy betsthat has weighed on both Treasury bond yields and theUS Dollar . That has understandably bolstered the appeal of non-interest-bearing and anti-fiat alternatives epitomized by the metal.
Meanwhile, crude oil prices are hovering at one-month highs. Recent gains appear to reflecthopes for a hefty dose of incoming monetary stimuluscoupled with supply disruption fears linked to swellingtensions between the US and Iran .
GOLD, CRUDE OIL PRICES MOVES MAY BE MUTED BEFORE G20 SUMMIT
A relatively quiet offering on the economic calendar at the start of the trading week may undercut scope for near-term trend development. BellwetherS & P 500futures are pointing convincingly higher, hinting at a risk-on tilt for overall sentiment trends.
To the extent that this marks continuation of last week's Fed-inspired optimism, gold and crude oil prices are likely to remain well-supported. Still, traders may be leery of committing one way or another ahead ofFriday's G20 summit , where markets hope to see the restart of US-China trade negotiations.
Did we get it right with our crude oil and gold forecasts?Get them hereto find out!
GOLD TECHNICAL ANALYSIS
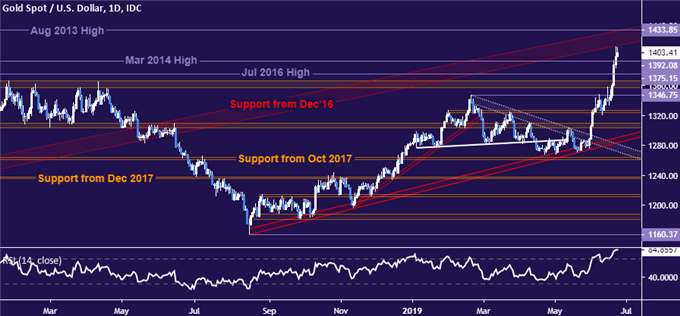
Gold prices are testing the underside of rising support-turned-resistance at set from December 2016, now at 1414.21. A break above that eyes the August 2013 high at 1433.85. Alternatively, a move back below support at 1392.08 opens the door for a challenge of 1375.15. next.
CRUDE OIL TECHNICAL ANALYSIS
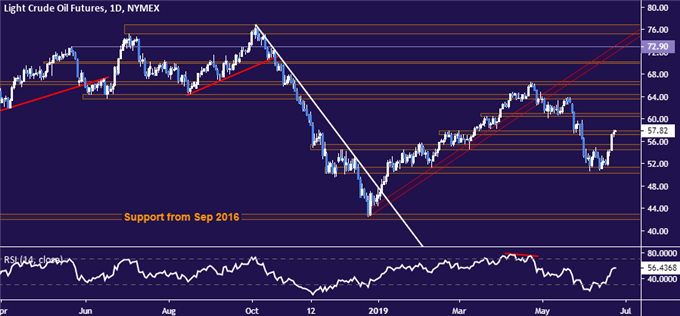
Crude oil prices continue to prove resistance in the 57.24-88 area. A daily close above that exposes the 60.39-95 zone. Alternatively, a move below the lower bound of immediate support at 54.55 sets the stage to challenge the 50.31-51.33 region again.
COMMODITY TRADING RESOURCESSee our guide to learn about thelong-term forces driving crude oil prices Having trouble with your strategy? Here's the#1 mistake that traders make Join a free webinarand have your commodity market questions answered
--- Written by Ilya Spivak, Currency Strategist for DailyFX.com
To contact Ilya, use the comments section below or@IlyaSpivakon Twitter
DailyFX
MENAFN2406201900760000ID1098676913
Legal Disclaimer:
MENAFN provides the information “as is” without warranty of any kind. We do not accept any responsibility or liability for the accuracy, content, images, videos, licenses, completeness, legality, or reliability of the information contained in this article. If you have any complaints or copyright issues related to this article, kindly contact the provider above.