(MENAFN- DailyFX) Platinum Price Forecast
Platinum charts and analysis. Platinum chart highlights an ongoing sideways pattern.
Did we get it right with our forecasts? Find out more for free from ourQ2 Gold and main currencies forecasts
Platinum Price – Holding Support
On June 14, Platinum failed in its second attempt to close above $817.0 reflecting weakness of the buyers to push the price higher. On June 18, the price carved out a lower low at $790.3 however, it rallied trading without any clear trend.
Alongside, the Relative Strength Index (RSI) pointed higher on June 18 however, it failed yesterday to cross above 50 highlighting the weakness of the buyers to start a bullish momentum.
Having trouble with your trading strategy?Here's the #1 Mistake That Traders Make
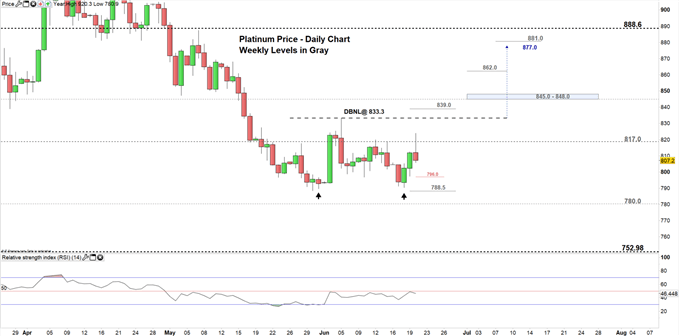
Platinum DAILY PRICE CHART (Mar 1, 2019 – JUn 20, 2019) Zoomed In
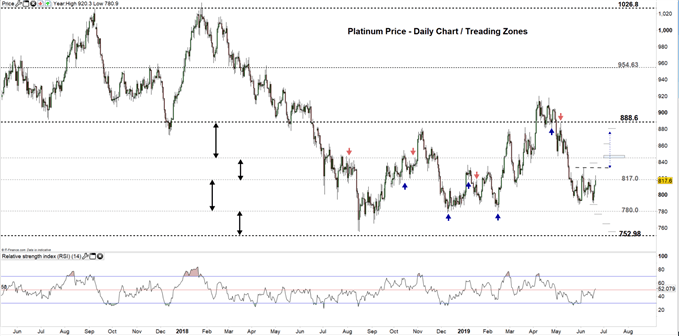
Platinum DAILY PRICE CHART (May 12, 2017 – JUn 20, 2019) Zoomed OUT
Looking at the daily chart we notice the buyer's intention to move Platinum to the higher trading zone at ($817.0 – $845.0) in order to test the neckline of a double bottom pattern residing at $833.3.
Therefore, if Platinum closes above the lower end of trading zone, it might rally towards the higher end. The price could head towards $877.0 contingent on remaining above the aforementioned neckline. See the chart for the weekly resistance zones and levels that need to be kept in focus.
In turn, If Platinum fails to close above the lower end, this could see the price trading even lower towards $780. However, the daily and weekly supports at $796.0 and $788.5 should be watched along the way.
Just getting started?See our Beginners' Guide for FX traders
Platinum Four-HOUR PRICE CHART (May27, 2019- JUN 12, 2019)
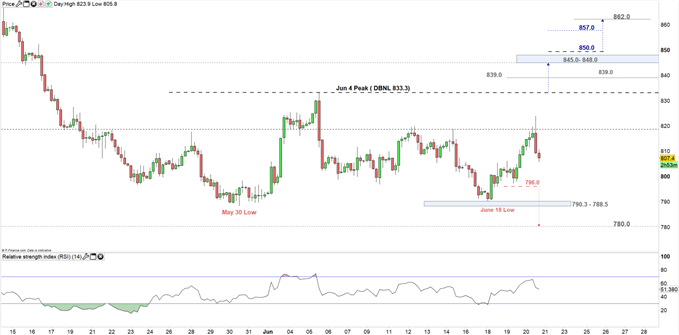
Looking at the four-hour chart we notice on June 18 rebounded from $790.3 and started an upwards trend carving out higher highs with higher lows.
The upwards trend could start to accelerate if Platinum breaks above the double bottom neckline. This could lead the price towards $845.0. See the chart for the resistances and key levels if the Platinum continues to rally.
On the flipside, if platinum breaks below the daily support at $796.0 this could send the price even lower towards $780 contingent on clearing the support zone from the June 18 low at $790.3 to the May 30 low at $788.5.
Written By:Mahmoud Alkudsi
Please feel free to contact me on Twitter: @Malkudsi
MENAFN2006201900760000ID1098664783
Legal Disclaimer:
MENAFN provides the information “as is” without warranty of any kind. We do not accept any responsibility or liability for the accuracy, content, images, videos, licenses, completeness, legality, or reliability of the information contained in this article. If you have any complaints or copyright issues related to this article, kindly contact the provider above.