(MENAFN- DailyFX) S & P 500/Dow Jones/Nasdaq 100 Outlook: S & P 500could 'react' around record highsDow Joneshas a couple of degrees of resistanceNasdaq100 a sign of risk appetite abating in near-term? Bonus chart: Russel 2k lagging severely, bad omen long-term?
See how the quarterly forecast has played out what it could mean for the big-picture –Q2 Equity Markets Forecast.
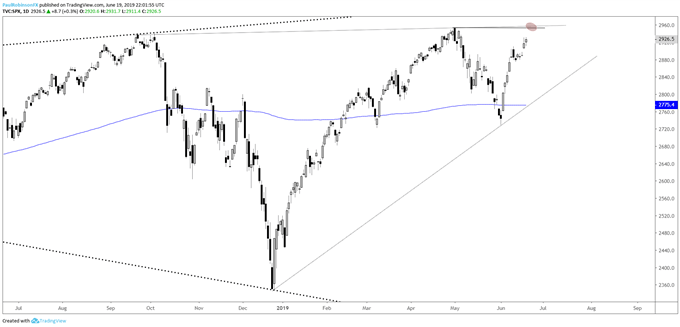
S & P 500 could 'react' around record highs
For the most part, the S & P 500 has gone up in straight-line fashion since bottoming at the beginning of this month, however; the rally could be dented soon. The record highs (2945 closing, 2954 intra-day) are just around the bend and if we see a sizable rejection it could put the path of least resistance in favor of shorts, at least in the near-term.
Even on a small breakout longs will want to be cautious as we could see the rug yanked shortly after achieving new high marks; it wouldn't be the first time we've seen this happen. How a decline might ensue should sellers show up is unclear yet. Generally, the market is still in 'bull-mode' and will require some aggressive downside price action for sellers to gain the upper hand.
For now, risk/reward isn't favorable for either side of the tape. We haven't yet seen the type of price action to warrant aggressive shorts and buying an extended move near the highs holds limited appeal.
Check out theIG Client Sentiment pageto see how retail traders are positioned and what it could potentially mean for various currencies and markets moving forward.
S & P 500 Daily Chart (Approaching record highs…)
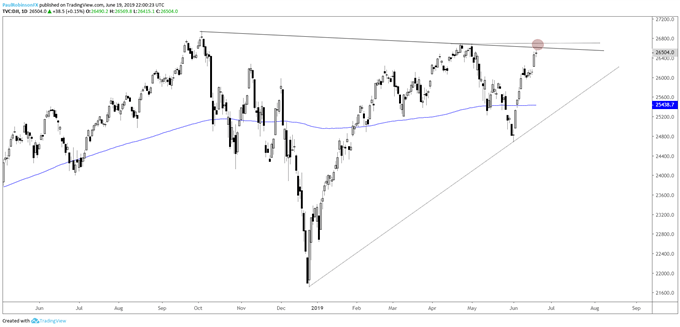
Dow Jones has a couple of degrees of resistance
The Dow Jones is trading right at a trend-line off the record high and the year high created in April at 26696. This could prove to be a formidable area with the S & P also near a major level. A breakout above the year high will have the record high at 26951 in focus soon after. (See S & P commentary above for take on price action…)
Dow Jones Daily Chart (Trend-line, price resistance)
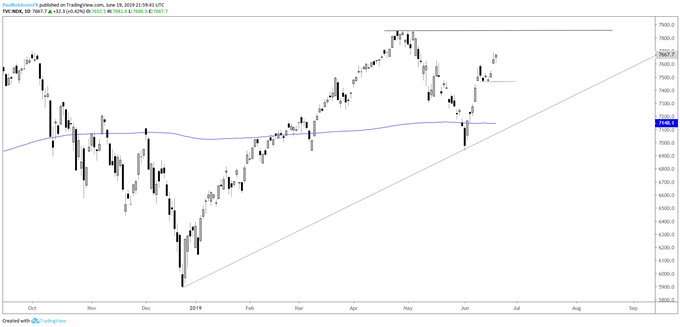
Nasdaq 100 a sign of risk appetite abating in near-term?
The Nasdaq 100, home of the darling FAANG group of stocks, isn't well off its highs, but far enough off that it could be a slight sign of risk appetite fading. This bull-market leader may be signaling that the S & P 500 might fade off record levels. Last month,I discussed Google/FAANG price behaviorand how it may have a big-picture impact.
Nasdaq 100 Daily Chart (lagging, a sign?)
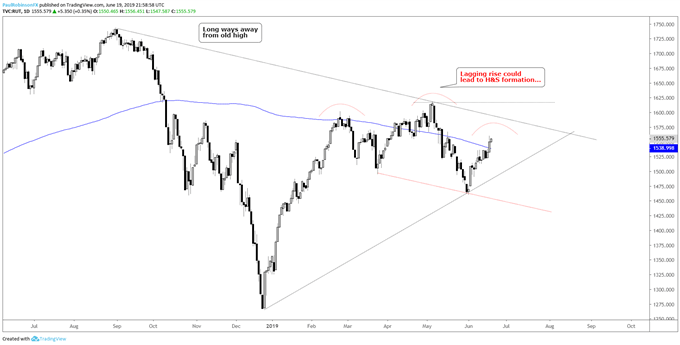
Bonus chart: Russel 2k lagging severely, bad omen for long-term?
The Russell 2000 is a small-cap index comprised of higher risk companies, and as such when risk appetite is strong the index tends to do well, and when it's not strong it can do what it is has been doing – lag behind. The divergence going back to last year is glaring and suggests that things in equity-land aren't as good as they might appear when looking at the large-cap indices. Even more recently since the high posted in May we are seeing the index lag behind by a fairly large margin.
The near-term lag could be leading to the right shoulder of a head-and-shoulders (H & S) pattern. We still need to see the Russell roll down and break the trend-line off the December low and ultimately the neckline of the pattern before a sizable spill can develop. But even in the process of getting to those points the rest of the market might start to turn with concerning force.
Continue to monitor this index in the short and long-term, even if the short-term divergence clears itself up, continued persistence in the long-term divergence may be a canary in the coal mine worth examining later on…
Russell 2000 Daily Chart (Lagging severely, possible H & S formation)
To learn more about U.S. indices, check out'The Difference between Dow, Nasdaq, and S & P 500: Major Facts & Opportunities.'You can join me everyWednesday at 10 GMTfor live analysis on equity indices and commodities, and for the remaining roster of live events, check out thewebinar calendar .
Tools for Forex & CFD Traders
Whether you are a beginning or experienced trader, DailyFX has several resources available to help you; indicator for trackingtrader sentiment , quarterlytrading forecasts , analytical and educationalwebinarsheld daily,trading guidesto help you improve trading performance, and one specifically for those who arenew to forex .
---Written by Paul Robinson, Market Analyst
You can follow Paul on Twitter at@PaulRobinsonFX
MENAFN2006201900760000ID1098661588
Legal Disclaimer:
MENAFN provides the information “as is” without warranty of any kind. We do not accept any responsibility or liability for the accuracy, content, images, videos, licenses, completeness, legality, or reliability of the information contained in this article. If you have any complaints or copyright issues related to this article, kindly contact the provider above.