(MENAFN- DailyFX) Gold Price Talking Points
The near-term breakout in theprice of goldappears to have stalled ahead of the 2018-high ($1366), but recent developments in the Relative Strength Index (RSI) indicate the bullish momentum could gather pace ahead of the Federal Reserve interest rate decision as the oscillator pushes into overbought territory.
Gold Price Forecast: RSI Triggers Overbought Signal Ahead of FOMC
Updates to the US Retail Sales report appears to have tamed gold prices, with bullion falling back from a fresh yearly-high ($1358) as the 0.5% expansion in household spendingoffers little evidence of a looming recession.
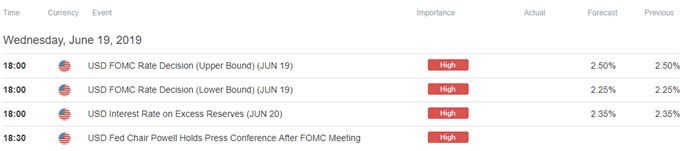
In turn, Federal Open Market Committee (FOMC) may vote unanimously to keep the benchmark interest rate in its current range of 2.25% to 2.50%, and the central bank may largely attempt to buy more time as 'participants generally agreed that a patient approach to determining future adjustments to the target range for the federal funds rate remained appropriate.'
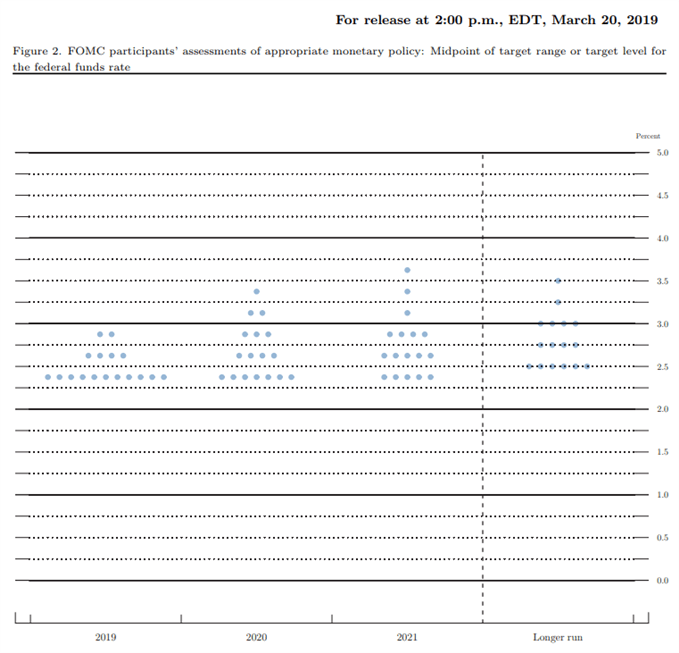
More of the same from theFOMCmay sap the appeal of gold as it dampens bets for an imminent rate cut, and it remains to be seen Chairman Jerome Powell and Co. will continue to project a longer run interest rate of 2.50% to 2.75% as 'a few participants noted that if the economy evolved as they expected, the Committee would likely need to firm the stance of monetary policy to sustain the economic expansion and keep inflation at levels consistent with the Committee's objective.'
However, a material change in the FOMC's forward guidance may fuel the near-term rally in gold especiallyas President Donald Trump tweets that 'the Fed interest rate way too high,' and Fed officials may change their tune over the coming months as the Trump administration relies on tariffs to push its agenda.
As a result, the Summary of Economic Projections (SEP) may show a downward revision in the interest rate dot-plot, and Fed Fund futures may continue to reflect a greater than 90% probability for September rate cut as the shift in US trade policy puts pressure on the FOMC to insulate the economy.
With that said,the current environment may keep the price of gold afloat especially as the break of the February-high ($1347) negates the threat of a head-and-shoulders formation.
Sign up and join DailyFX Currency Strategist David Song LIVEfor an opportunity to discuss potential trade setups.
Gold Price Daily Chart
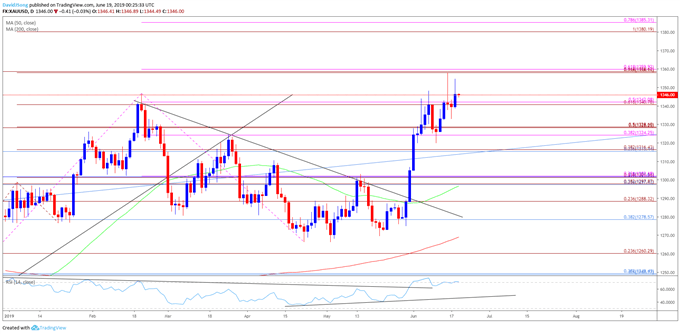
The broader outlook for gold is no longer mired by a head-and-shoulders formation as both price and the Relative Strength Index (RSI) break out of the bearish trends from earlier this year. However, the near-term rally in the bullion appears to have stalled ahead of the 2018-high ($1366) as the price for gold snaps the string of higher highs and lows from the previous week. The failed attempt to break/close above the Fibonacci overlap around $1358 (78.6% expansion) to $1360 (61.8% expansion) raises the risk for a larger correction, with a move below the $1340 (61.8% expansion) to $1342 (50% expansion) region opening up the $1324 (38.2% expansion) to $1329 (50% expansion) zone. Nevertheless, recent developments in the RSI suggest the bullish momentum is gathering pace as the oscillator pushes back into overbought territory, but need a break/close above the $1358 (78.6% expansion) to $1360 (61.8% expansion) region to open up the overlap around $1380 (100% expansion) to $1385 (78.6% expansion).
For more in-depth analysis, check out the2Q 2019 Forecast for Gold
Additional Trading Resources
Are you looking to improve your trading approach? Review the ' Traits of a Successful Trader ' series on how to effectively use leverage along with other best practices that any trader can follow.
Want to know what other currency pairs the DailyFX team is watching? Download and review theTop Trading Opportunitiesfor 2019
--- Written by David Song, Currency Strategist
Follow me on Twitter at @DavidJSong.
DailyFX
MENAFN1806201900760000ID1098654667
Legal Disclaimer:
MENAFN provides the information “as is” without warranty of any kind. We do not accept any responsibility or liability for the accuracy, content, images, videos, licenses, completeness, legality, or reliability of the information contained in this article. If you have any complaints or copyright issues related to this article, kindly contact the provider above.