(MENAFN- DailyFX) Gold Price Technical Outlook: Gold pricereversal candle at big resistance suggests lower prices Will take a lot of buying to get gold into the clear on the upside
For forecasts, educational content, and more, check out theDailyFX Trading Guidespage.
Gold price reversal candle at big resistance suggests lower prices
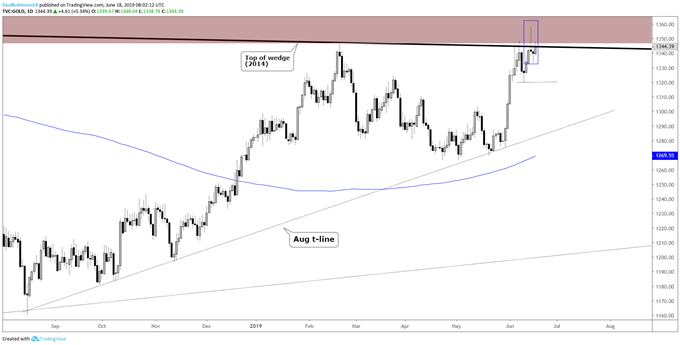
On Friday, gold was pushing strongly into a thicket of long-term resistance from around the mid-1340s up to 1375 before sellers pushed it back down, carving out a closing reversal candlestick (i.e. 'shooting star', 'pin bar', etc.) that warns of weakness thereafter. The combination of resistance and reaction makes a solid case for sellers.
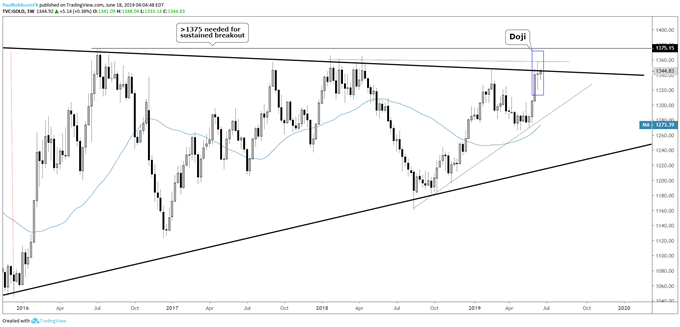
On the weekly time-frame, last week's volatile week of price action created a long-legged Doji, a candlestick that demonstrates a power struggle between buyers and sellers. Given where it developed on the chart its significance is elevated.
Today's small push higher may only turn out to be a minor retest of last week's reversal event. A break below yesterday's low at 1333 could have selling interest increase as momentum to the downside picks up. Support comes in at last week's low, but if the Doji is to hold its power then the 1320 level may quickly break and have attention turned towards the August trend-line near 1300.
To negate Friday's reversal, we will need to see a close above 1358, but even then gold will still be trading in the long-term zone of resistance. A weekly close above the aforementioned high will be needed to negate the Doji, but unless a close can development on a weekly basis above the July 2016 high of 1375, risk for yet another strong turn lower will remain elevated.
The bottom line is, risk of lower prices is quite elevated from here given both price levels and price action, and even if a bit more strength is to develop, until gold clears itself of all major long-term hurdles and breaks the multi-year wedge with conviction, risk/reward from where I sit isn't favorable for fresh longs. Would-be shorts may want to lean on resistance up to 1375 as a backstop for bearish bets.
Check out theIG Client Sentimentpage to see how changes in trader positioning can help signal the next price move in gold and other major markets and currencies.
Gold Price Weekly Chart (Doji at major resistance)

Gold Price Daily Chart (reversal candlestick)

Resources for Forex & CFD Traders
Whether you are a new or experienced trader, we have several resources available to help you; indicator for trackingtrader sentiment , quarterlytrading forecasts , analytical and educationalwebinarsheld daily,trading guidesto help you improve trading performance, and one specifically for those who arenew to forex .
---Written by Paul Robinson, Market Analyst
You can follow Paul on Twitter at@PaulRobinsonFX
MENAFN1806201900760000ID1098650926
Legal Disclaimer:
MENAFN provides the information “as is” without warranty of any kind. We do not accept any responsibility or liability for the accuracy, content, images, videos, licenses, completeness, legality, or reliability of the information contained in this article. If you have any complaints or copyright issues related to this article, kindly contact the provider above.