(MENAFN- DailyFX) Crude Oil Price Talking Points: Sellers haven't left the Crude Oil market after a brutal month of May . The latter-half of last week saw prices bounce from a key support zone, but sellers re-appeared this week after prices touched the resistance zone looked at in the early-month forecast forCrude OilPrices. Crude Oil has pushed down to the 51.50 area that was looked at for an initial target, but might bears be aggressive enough to elicit a run down to the 50 psychological level? Crude Oil Collapse Continues After Resistance Inflection Crude Oil prices experienced a stark change-of-pace in the month of May. While Oil prices had previously tracked the return of the risk trade fairly-well, bottoming out around Christmas and running-higher through Q1 and into April; sellers showed up in May, with aggression, to erase a large portion of that move. In short order, Crude Oil prices had cut through a number of support levels, making a hard-charge down to fresh four-month-lows.
In theCrude Oil Technical Forecast to start this month , I had looked at a series of levels that remain in-play. The resistance zone investigated that runs from 54.49-55.57 has now caught two different resistance reactions. The support level around 51.50 that was looked at for initial targets has now caught two separate inflections; the first of which was a mere speed bump on the way-lower while the second is helping to hold the lows right now.
WTI Crude Oil Four-Hour Price Chart: From Resistance to Support – Now What?
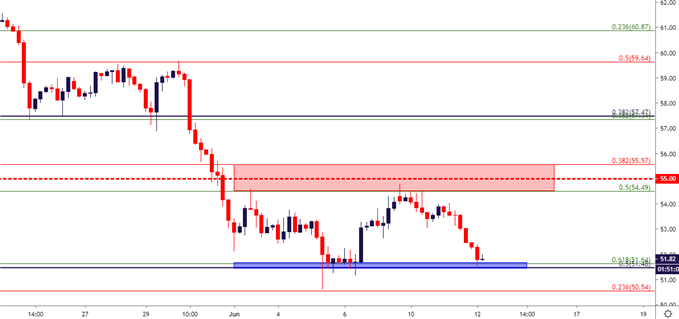
Chart prepared byJames Stanley
Crude Oil Prices: More Room to Fall or Ready to Retrace? At this point, the big question is whether the short-side move has anymore juice left to squeeze, and it may. But at this point, initiating fresh bearish exposure could be of a challenge considering how far away prices have fallen from the recent swing-high.
This can then present a few differing scenarios:
With current prices showing support at a confluent area on the chart, and with sellers thus far showing an unwillingness to test last week's lows, and the door may be opening for a retracement move given this current higher-low to go along with last week's higher-high. This bounce may run up to the 52.50 psychological level or perhaps even the 53.00 level which provided a bit of swing support on Monday. These levels can function as near-term targets on reversal/retracement plays or, alternatively, can be integrated by sellers as areas to look for lower-high resistance potential.
WTI Crude Oil Price Two-Hour Chart
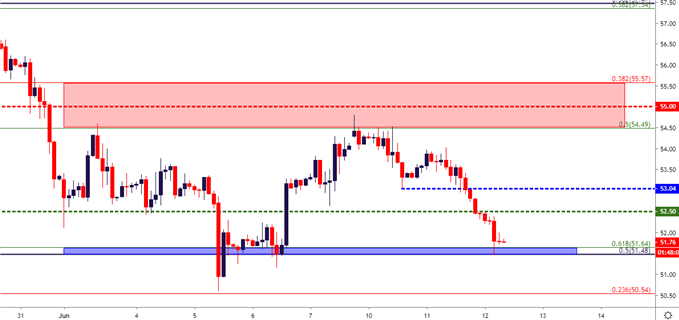
Chart prepared byJames Stanley
On the short side of the move, the current quandary would be one of chart position. With resistance almost a full $3 away, the risk would simply be difficult to justify givenprice action'sproximity to support. If sellers are able to break to fresh lows, the 50 psychological level awaits; and incorporating a simple one-to-one risk-reward would necessitate a push down towards 48.50, which could be difficult to target given the number of events that would likely need to happen to elicit a clean cut through all of that support.
Instead, sellers can look for a bounce up to one of the aforementioned resistance levels or, alternatively, look for downside breakout strategies in order to capitalize on a 'fear' theme that hasn't yet left Crude Oil markets. A break-below this week's low at the 51.47Fibonacci levelopens the door for a test of last week's low; after which the 50 level comes into play for short-side target potential.
WTI Crude Oil Eight-Hour Price Chart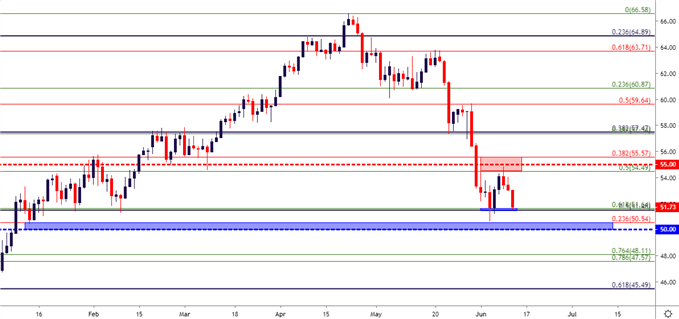 Chart prepared byJames Stanley
To read more: Are you looking for longer-term analysis on the U.S. Dollar? OurDailyFX Forecasts have a section for each major currency, and we also offer a plethora of resources onGoldorUSD -pairs such asEUR/USD ,GBP/USD ,USD/JPY ,AUD/USD . Traders can also stay up with near-term positioning via ourIG Client Sentiment Indicator .
Forex Trading Resources
DailyFX offers an abundance of tools, indicators and resources to help traders. For those looking for trading ideas, ourIG Client Sentimentshows the positioning of retail traders with actual live trades and positions. Ourtrading guidesbring our DailyFX Quarterly Forecasts and our Top Trading Opportunities; and ourreal-time news feedhas intra-day interactions from the DailyFX team. And if you're looking for real-time analysis, ourDailyFX Webinarsoffer numerous sessions each week in which you can see how and why we're looking at what we're looking at.
If you're looking for educational information, ourNew to FX guideis there to help new(er) traders while ourTraits of Successful Traders researchis built to help sharpen the skill set by focusing on risk and trade management.
--- Written by James Stanley, Strategist for DailyFX.com
Contact and follow James on Twitter:@JStanleyFX
MENAFN1206201900760000ID1098634419
Legal Disclaimer:
MENAFN provides the information “as is” without warranty of any kind. We do not accept any responsibility or liability for the accuracy, content, images, videos, licenses, completeness, legality, or reliability of the information contained in this article. If you have any complaints or copyright issues related to this article, kindly contact the provider above.