(MENAFN- DailyFX) TALKING POINTS – TRADE WAR, IBGE INFLATION IPCA-15, BRL, IBOVESPAFading optimism over US-China trade resolution nauseating markets Brazil inflation data may skew inflationary risks and monetary policy Pension reform progress remains a headline risk to economy outlook See our free guide to learn how touse economic news in your trading strategy !
The Brazilian Real may find itself under pressure after local inflation data is published. Month-on-month price growth is expected at 0.41 percent, slightly lower than the previous report at 0.72 percent. The Brazilian economy at this time is in a fragile state by virtue of the uncertainty caused by the US-China trade war and local structural reforms.The latter is arguably one of the biggest drivers of price action in Brazilian markets .
Earlier this month, the Brazilian central bank announced that it was going to hold the benchmark Selic rate at 6.50 percent –as expected.Policymakers noted that while local economic activity was weaker,inflationary risks remain broadly 'symmetrical' . This has allowed monetary authorities the luxury of holding rates while local pension reforms talks continue, though external headwinds and local CPI may derail their neutrality.
Additional risks to inflationary pressure include the current state of Brazil-China relations. Yesterday marked the first day ofinvestment negotiations between Brazilian Vice President Hamilton Mourao and high-level Chinese officials.If the negotiations between the two emerging market giants go well, it could boost sentiment in the Brazilian economy and provide a tailwind for inflation.
However, whatever deal is achieved between China and Brazil will likely be offset by souring relations between Beijing and Washington. Both sides appear to be digging their heels in with US President Donald Trump nowadding additional measures involving Chinese tech-leviathan Huawei . Finding a resolution now against what is an already-unhospitable backdrop will likely only continue to sour global sentiment.
BRL PRICE CHART ANALYSIS The Brazilian Real has been rapidly falling against theUS Dollar , with USD/BRL recently puncturing the 4.000 landmark. The last time the pair reached this level was back in October of 2018. The pair appear to be hovering just above what may be a new psychological floor. The long wicks on both sides of the short-bodied daily candles indicates indecision.
USDBRL reaching October 2018-highs… But for how long?
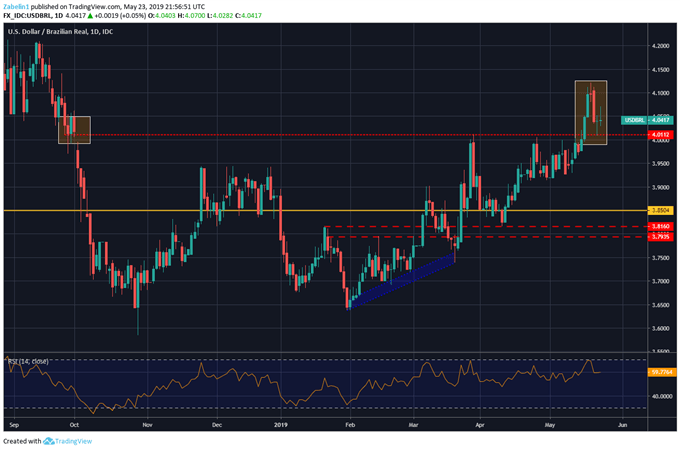
It appears that only a favorable – or unfavorable – fundamental development in either the pension reforms or US-China trade relations will be a key force in determining the pair's bearish or bullish trajectory. Looking ahead, monitoring these crucial factors will be essential to maintaining a well-informed trading strategy. To learn more about Brazilian assets, you mayfollow me on Twitter @ZabelinDimitri .
FX TRADING RESOURCESJoin a free webinar andhave your trading questions answered Just getting started?See our beginners' guide for FX traders Having trouble with your strategy?Here's the #1 mistake that traders make --- Written by Dimitri Zabelin, Jr Currency Analyst for DailyFX.com
To contact Dimitri, use the comments section below or@ZabelinDimitri on Twitter
DailyFX
MENAFN2305201900760000ID1098563464
Legal Disclaimer:
MENAFN provides the information “as is” without warranty of any kind. We do not accept any responsibility or liability for the accuracy, content, images, videos, licenses, completeness, legality, or reliability of the information contained in this article. If you have any complaints or copyright issues related to this article, kindly contact the provider above.