(MENAFN- DailyFX)
GOLD & CRUDE OIL TALKING POINTS: Gold pricesrudderless as Brexit news-flow offers conflicting influencesCrude oil pricesremain range-bound, eyeing EIA inventory flow reportFOMCmeeting minutes may cool rate cut bets, hurt commodity prices Gold prices struggled to for direction, trading inversely of seesaw swings in theUS Dollar . It succumbed to cross-currents from a jump in theGBP/USDexchange rate after UK Prime Minister Theresa Mayfloated the possibility of a second Brexit referendum . The move promptly fizzled however, with a rebound in the benchmark currency cooling anti-fiat demand and forcing the yellow metal to retreat.
All eyes now turn to minutes from May's FOMC meeting. Commentary reiterating officials' wait-and-see approach amid a raft of global uncertaintiesmay cool rate cut hopes . That seems inherently USD-supportive, with haven demand acting as a further accelerant as markets pining for policy support tilt into risk-off territory. Gold is vulnerable in this scenario.
Crude oil prices swung modestly lower but remained well within the narrow congestion range prevailing since late last week. Fed-inspired risk aversion might make for a more committed selloff. Pressure may be compounded if EIA inventory data echoes an API projection showing US stocks added 2.4 million barrels last week. Analysts are betting on a 1.28-million-barrel increase.
Did we get it right with our crude oil and gold forecasts?Get them hereto find out!
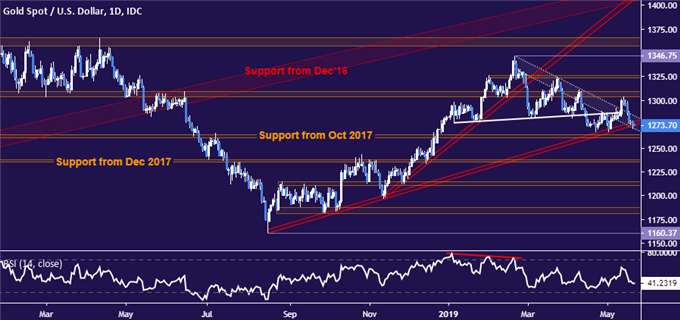
GOLD TECHNICAL ANALYSIS Gold prices are still probing support at a rising trend line guiding them higher since mid-August 2018. This is bolstered by the 1260.80-63.76 inflection area. A daily close below that targets the 1235.11-38.00 zone thereafter. Alternatively, a rebound above resistance in the 1303.70-09.12 region broadly aims for February's high at 1346.75, with a minor hurdle in the 1323.40-26.30 price band along the way.
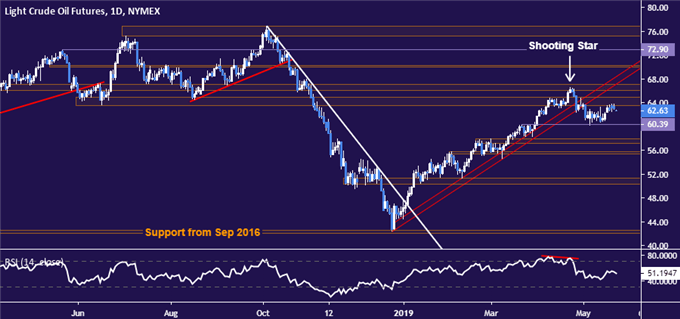
CRUDE OIL TECHNICAL ANALYSIS Crude oil prices continue to mark time at the lower bound of a dense block of overlapping resistance levels in the 63.59-67.03 area. If buyers manage the wherewithal to breach it, an opening to retest the $70/bbl figure may present itself. Alternatively, a drop through near-term support at 60.39 sees the next downside barrier in the 57.24-88 zone.
 COMMODITY TRADING RESOURCESSee our guide to learn about thelong-term forces driving crude oil prices Having trouble with your strategy? Here's the#1 mistake that traders make Join a free webinarto answer your commodity market questions --- Written by Ilya Spivak, Currency Strategist for DailyFX.com
To contact Ilya, use the comments section below or@IlyaSpivakon Twitter
DailyFX
MENAFN2205201900760000ID1098553368
Legal Disclaimer:
MENAFN provides the information “as is” without warranty of any kind. We do not accept any responsibility or liability for the accuracy, content, images, videos, licenses, completeness, legality, or reliability of the information contained in this article. If you have any complaints or copyright issues related to this article, kindly contact the provider above.