(MENAFN- DailyFX) Oil Price Talking Points Oil prices appear to be stuck in a narrow range amid the ongoing trade dispute between the U.S. and China, the two largest consumers of crude, but theprice of oilmay continue to catch a bid in 2019 as the Organization of the Petroleum Exporting Countries (OPEC) pledge to keep 'inventories under control.'
Oil Prices Cling to Bullish Trend as OPEC+ Alliance Remains in Effect The ongoing threat of a U.S.-China trade war may continue to drag on oil prices as the Organisation for Economic Co-operation and Development (OECD) warns 'trade tensions are not only hurting the short-term outlook but also medium-term prospects, calling for urgent government action to reinvigorate growth.'
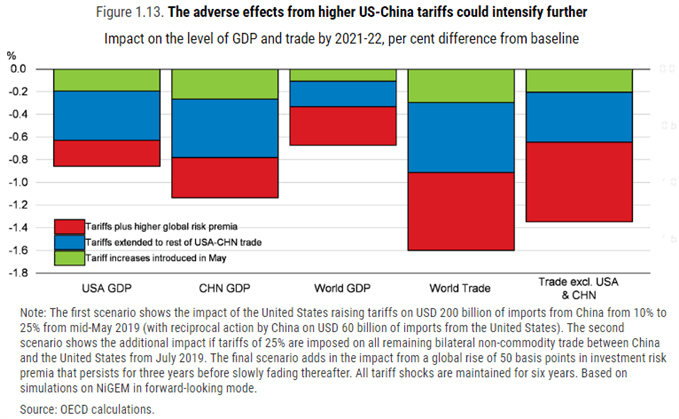
The OECD goes onto say that 'the tariffs imposed by the United States and China in 2018, which are incorporated in the projections, have already started to slow growth and add to inflation,' with the group highlighting the adverse effects from the trade dispute as 'there is also a risk of additional tariffs being implemented in the future, covering the full spectrum of trade between the United States and China.'
It remains to be seen if OPEC and its allies will respond to the weakening outlook for global growth as Saudi Arabia Minister of Energy, Industry and Mineral ResourcesKhalid A. Al-Falih insists that 'the vigorous participation of select countries, and its visible results, have shown the full potential of OPEC+ if everyone plays a full role,' and the ongoing alliance may keep crude prices afloat ahead of the next meeting on June 25 as the group remains in no rush to boost production.
With that said, oil prices may continue to track the upward trending channel from earlier this year as the OPEC + alliance remains in effect, and the current environment may bring the topside targets back on the radar as crude trades near the monthly-high ($63.93).
Oil Daily Chart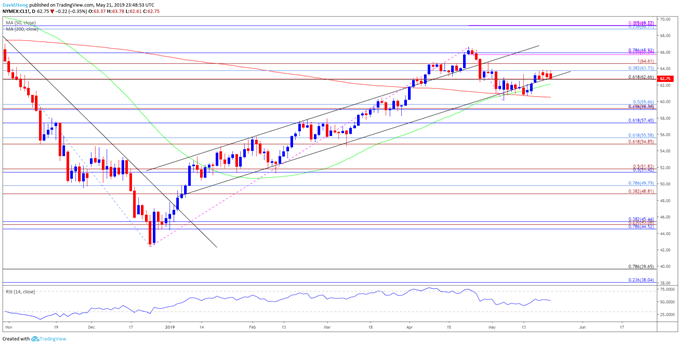 Keep in mind, a 'golden cross' formation appears to have taken shape as the 50-Day SMA ($61.18) crosses above the 200-Day SMA ($60.76), but the difference in slope undermines the potential for a bullish signal. Nevertheless, the pullback in crude appears to have run its course following the failed attempt to test the Fibonacci overlap around $59.00 (61.8% retracement) to $59.70 (50% retracement), but need a break/close above the $62.70 (61.8% retracement) to $63.70 (38.2% retracement) to bring the $64.60 (100% expansion) region on the radar. Next topside hurdle comes in around $65.70 (23.6% expansion) to $65.90 (78.6% retracement) followed by the overlap around $68.80 (23.6% retracement) to $69.20 (50% retracement). For more in-depth analysis, check out the2Q 2019 Forecast for Oil
Additional Trading Resources Are you looking to improve your trading approach? Review the ' Traits of a Successful Trader ' series on how to effectively use leverage along with other best practices that any trader can follow.
Want to know what other markets the DailyFX team is watching? Download and review theTop Trading Opportunitiesfor 2019.
--- Written by David Song, Currency Strategist
Follow me on Twitter at @DavidJSong.
DailyFX
MENAFN2105201900760000ID1098552854
Legal Disclaimer:
MENAFN provides the information “as is” without warranty of any kind. We do not accept any responsibility or liability for the accuracy, content, images, videos, licenses, completeness, legality, or reliability of the information contained in this article. If you have any complaints or copyright issues related to this article, kindly contact the provider above.